Fig. 1
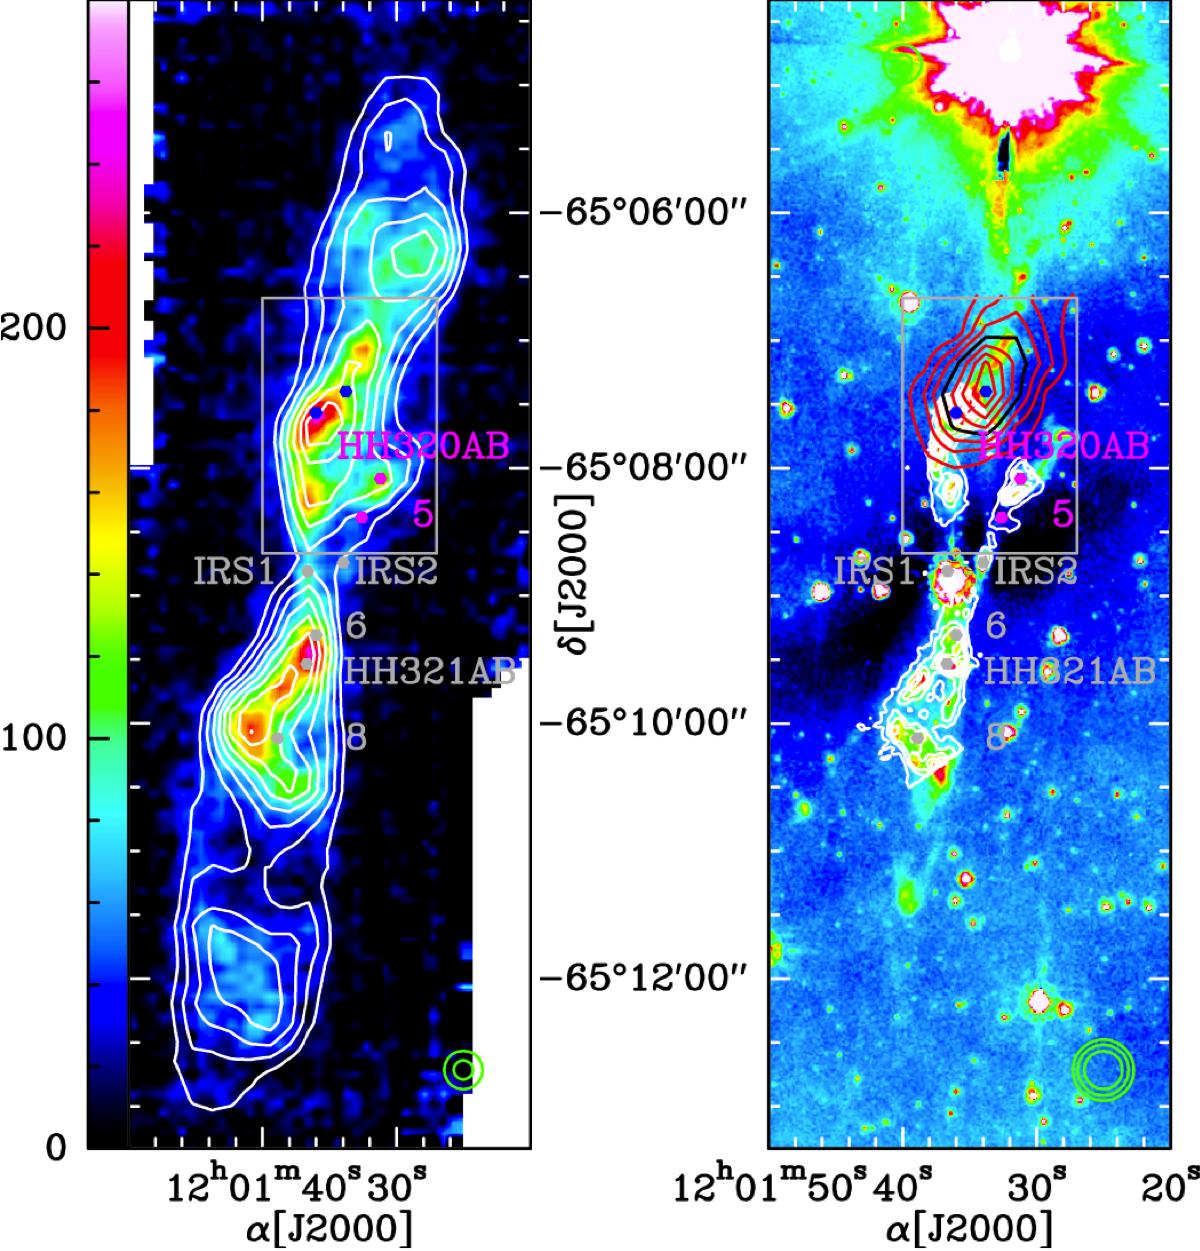
The BHR71 bipolar outflow in its entirety, in left: CO (6−5) (colours, associated with the wedge, in main beam temperature units, K km s-1) and (3–2) (white contours, from 30% to 100% of the signal in steps of 10%), both observed by the APEX telescope and integrated between −50 and +50 km s-1, with the resolutions indicated by green circles in the lower right corner; right: the 8 μm emission detected by the Spitzer/IRAC receiver (colours, N09), with the H2 0–0 S(5) emission as observed by the Spitzer/IRS receiver in the inner parts of the outflow (white contours, from G11), and the SiO (5–4) emission (red and black contours, G11) in the upper lobe (the green circles in the lower right corner show the respective resolutions of CO (3–2), (11–10) and SiO (5–4)). On both maps, the grey inset is the field shown in Fig. 2, the SiO peak and knot positions are indicated in blue, the knot 5 and HH320 region are in pink, and the IRS 1&2, knots 6, 8, and HH321 region are indicated by grey dots.
Current usage metrics show cumulative count of Article Views (full-text article views including HTML views, PDF and ePub downloads, according to the available data) and Abstracts Views on Vision4Press platform.
Data correspond to usage on the plateform after 2015. The current usage metrics is available 48-96 hours after online publication and is updated daily on week days.
Initial download of the metrics may take a while.