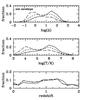
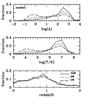
Fig. 4

Fraction of the X-ray optical depth at the observed energy E = 0.5 keV as a function of the cell over-density, temperature, and redshift (from top to bottom). The left panels refer to the mean of the five LOS with the minimal absorption, while the right panels refer to the mean of 68% of the LOS around the median. Solid, short-dashed, and long-dashed lines refer to the VZW, SW, and CW models, respectively. Note that the CW model slightly overpredicts the minimum envelope of the NH − z distribution, as noted in the text.
Current usage metrics show cumulative count of Article Views (full-text article views including HTML views, PDF and ePub downloads, according to the available data) and Abstracts Views on Vision4Press platform.
Data correspond to usage on the plateform after 2015. The current usage metrics is available 48-96 hours after online publication and is updated daily on week days.
Initial download of the metrics may take a while.