Fig. 3
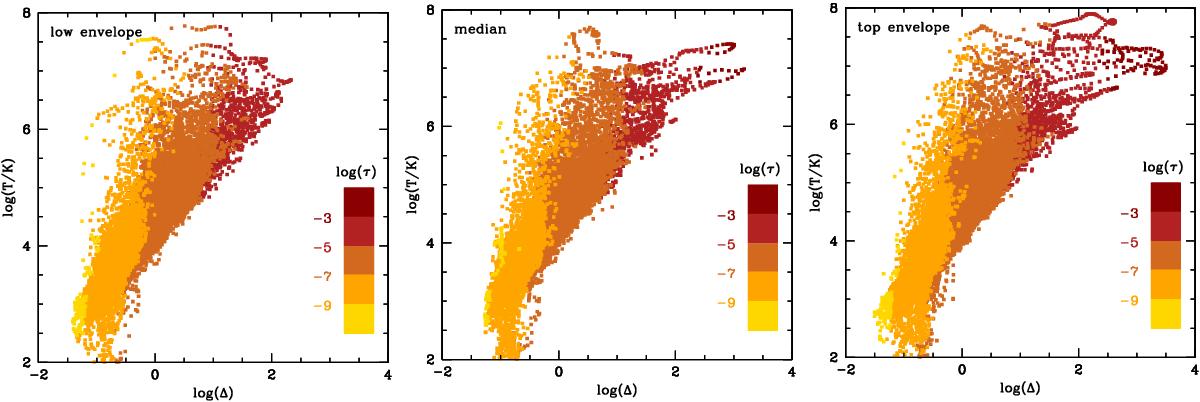
Individual contribution of cells in the Δi − Ti plane for the reference momentum-driven wind model along three different LOS: left panel refers to the LOS with the lowest absorption. The optical depth along this LOS in our simulation is τ(0.5 keV) = 0.06. Central panel indicates the median LOS corresponding to the solid, black line in Fig. 2, the median optical depth is τ(0.5 keV) = 0.21. The right panel refers to the LOS defining the top envelope of simulated curves in Fig. 2. In this case the optical depth is τ(0.5 keV) = 0.88. The colour scale represents the value of τi computed at 0.5 keV. The LOS with the lower absorption lacks of cells with Δi> 100. Instead these cells dominate the X-ray optical depth in the median and top LOS, where most (~60%) of the absorption is provided by two systems with Δi> 300 and Ti> 106 K (dark red points).
Current usage metrics show cumulative count of Article Views (full-text article views including HTML views, PDF and ePub downloads, according to the available data) and Abstracts Views on Vision4Press platform.
Data correspond to usage on the plateform after 2015. The current usage metrics is available 48-96 hours after online publication and is updated daily on week days.
Initial download of the metrics may take a while.