Fig. 2
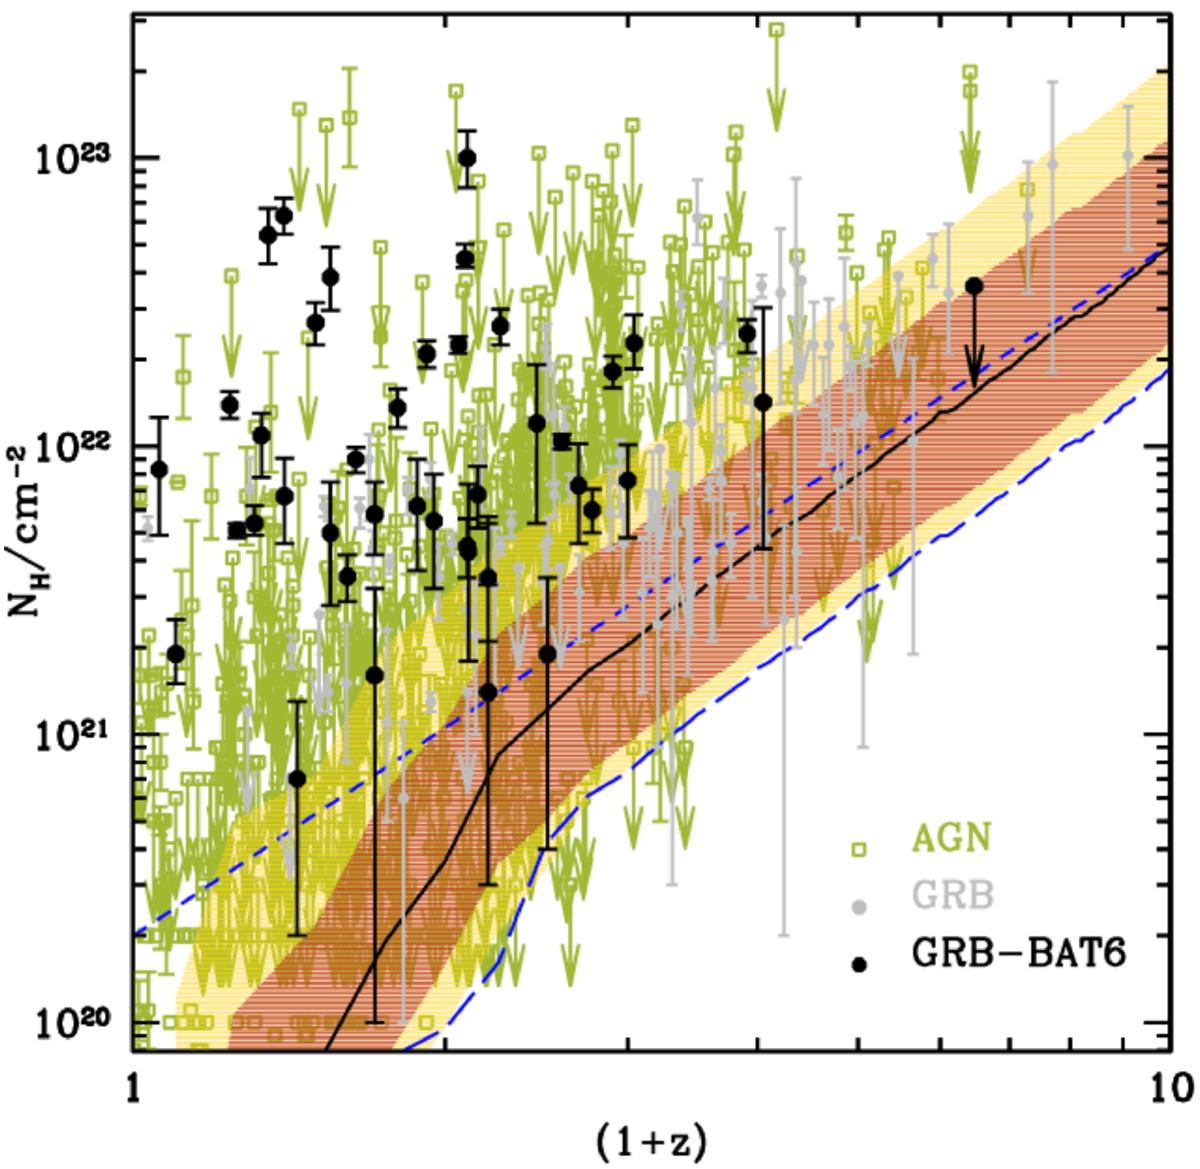
Distribution of equivalent hydrogen column densities, NH, with redshift as measured for different sources: GRBs with measured redshift (grey dots), bright GRBs in a redshift complete sample (black dots), and AGN (green squares). Error bars are at 1σ confidence level. The long dashed curve represents the LOS with the lowest absorption, i.e. with no absorbers with density contrast Δ > 100, and constant metallicity (Z ~ 0.03 Z⊙). This curve was obtained from cosmological simulations, summing up the contribution by each cell, with an absorbing column density weighted for its effective (temperature-dependent) value. The results for a physically motivated model of SN winds (momentum-driven model by Oppenheimer et al. 2012) are shown by the solid line (median of LOS distribution) and corresponding shaded areas (68% and 90% of LOS, respectively). The short dashed line corresponds to the median LOS with log NH = 20.3 ± 0.1 (1σ confidence level) obtained considering constant metallicity (Z = 0.3 ± 0.1 Z⊙) in absorbers with 100 < Δ < 1000.
Current usage metrics show cumulative count of Article Views (full-text article views including HTML views, PDF and ePub downloads, according to the available data) and Abstracts Views on Vision4Press platform.
Data correspond to usage on the plateform after 2015. The current usage metrics is available 48-96 hours after online publication and is updated daily on week days.
Initial download of the metrics may take a while.