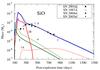
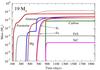
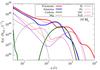
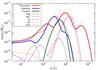
Fig. 7
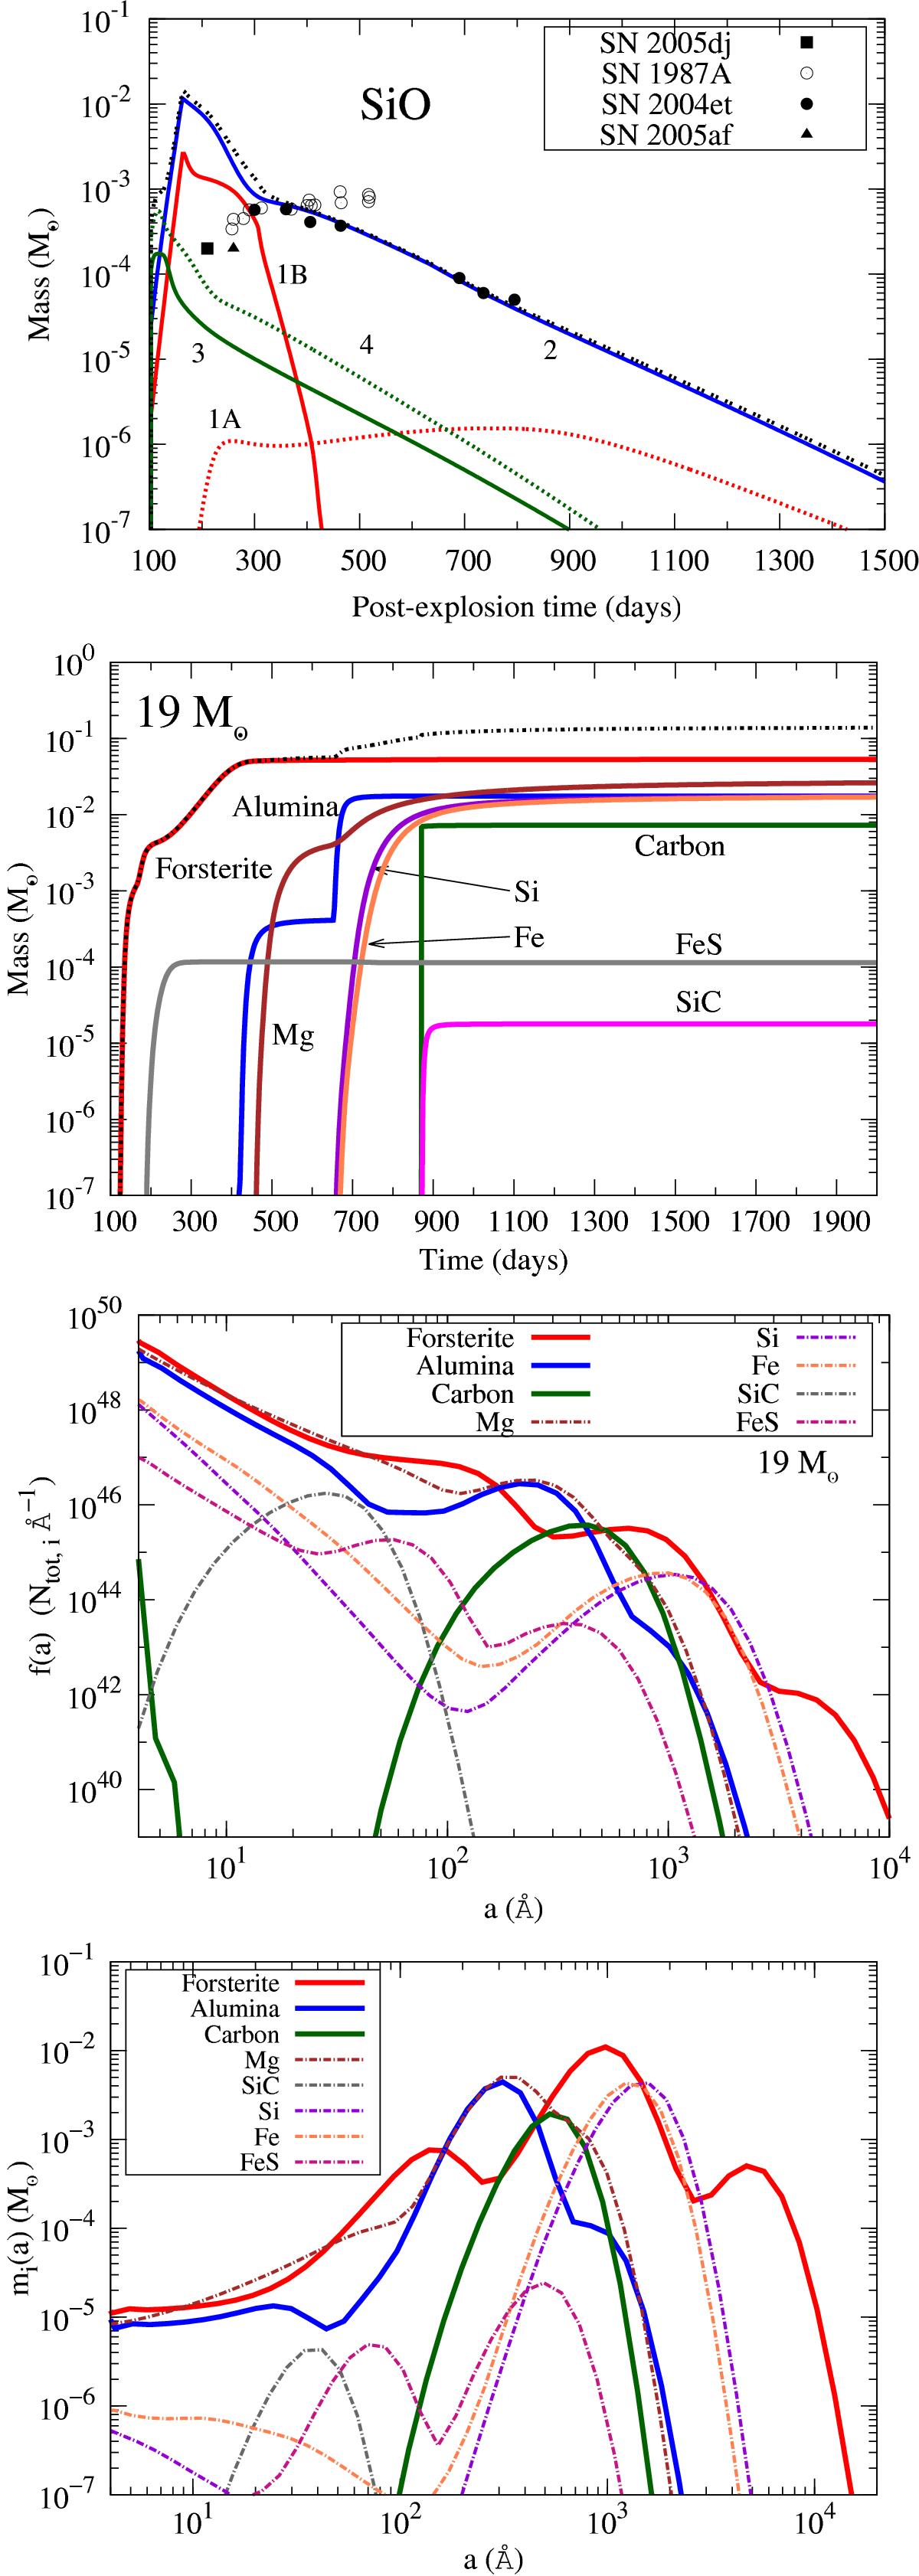
Results for the 19 M⊙ clumpy model: Top-left: SiO mass as a function of post-explosion time. Observational data for several supernovae are given as symbols. Top-right: dust mass as a function of post-explosion time and dust type. Bottom-left: grain size distributions of the various dust components at day 2000. Bottom-right: mass distributions of the various dust components at day 2000.
Current usage metrics show cumulative count of Article Views (full-text article views including HTML views, PDF and ePub downloads, according to the available data) and Abstracts Views on Vision4Press platform.
Data correspond to usage on the plateform after 2015. The current usage metrics is available 48-96 hours after online publication and is updated daily on week days.
Initial download of the metrics may take a while.