Fig. 10
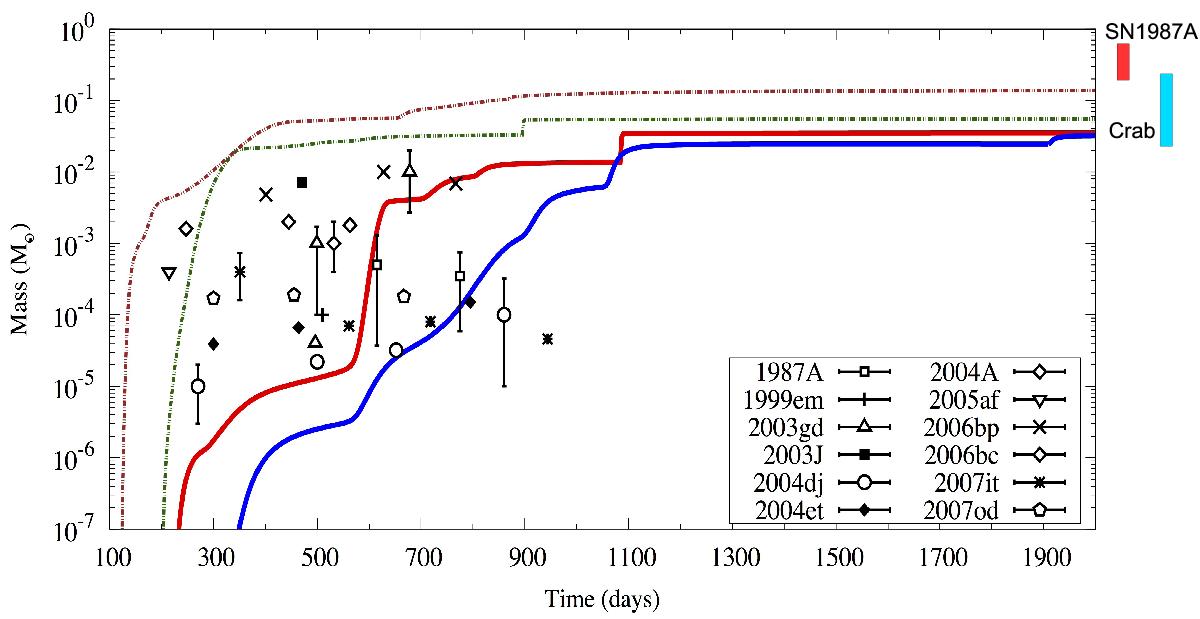
Total modelled dust masses versus post-explosion time for the various SN cases considered in this study and dust masses derived from mid-IR data for a sample of Type II-P SNe-SN1987A (Wooden et al. 1993; Ercolano et al. 2007), SN1999em (Elmhamdi et al. 2003), SN2003gd (Sugerman et al. 2006; Meikle et al. 2007), SN2003J (Szalai & Vinkó 2013), SN2004dj (Szalai et al. 2011; Meikle et al. 2011), SN2004et (Kotak et al. 2009), SN2004A (Szalai & Vinkó 2013), SN2005af (Kotak 2008), SN2006bp (Gallagher et al. 2012; Szalai & Vinkó 2013), SN2007it (Andrews et al. 2011), SN2007od (Inserra et al. 2011; Andrews et al. 2010). The bars associated with the data points indicate the range of mass values derived from various authors or models for a specific SN. Full blue and red lines: 19 M⊙ and 15 M⊙ homogeneous ejecta, respectively. Green dotted line: low 56Ni mass, 15 M⊙ homogeneous ejecta. Brown dotted line: 19 M⊙ clumpy ejecta. The dust masses derived for the young remnant SN1987A and the Crab Nebula are also shown (SN1987A – Matsuura et al. 2011; Indebetouw et al. 2014, The Crab – Gomez et al. 2012; Temim & Dwek 2013).
Current usage metrics show cumulative count of Article Views (full-text article views including HTML views, PDF and ePub downloads, according to the available data) and Abstracts Views on Vision4Press platform.
Data correspond to usage on the plateform after 2015. The current usage metrics is available 48-96 hours after online publication and is updated daily on week days.
Initial download of the metrics may take a while.