Fig. 4
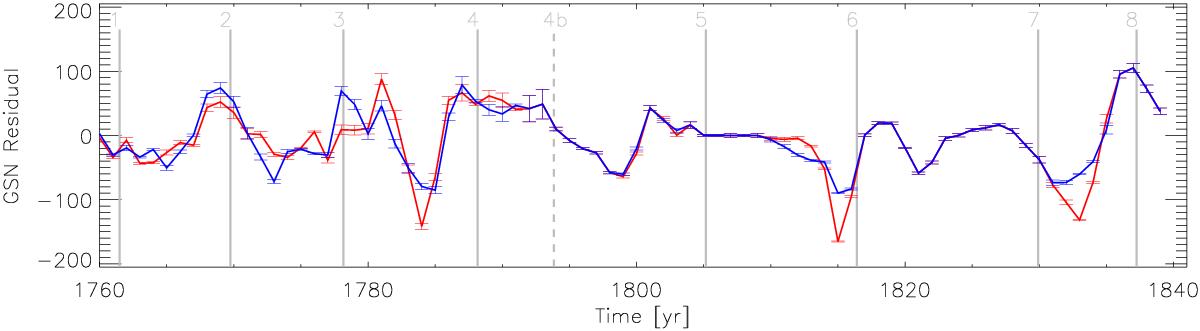
Residuals between the observed GSN and the GSN calculated based on 10Be measurements and assuming a cycle 4b (blue line) and the GSN calculated based on 10Be measurements and not assuming a cycle 4b (red line) as in Fig. 2. Again, the solid grey lines indicate the midpoints of the canonical solar cycles and the dashed line indicates the midpoint of cycle 4b.
Current usage metrics show cumulative count of Article Views (full-text article views including HTML views, PDF and ePub downloads, according to the available data) and Abstracts Views on Vision4Press platform.
Data correspond to usage on the plateform after 2015. The current usage metrics is available 48-96 hours after online publication and is updated daily on week days.
Initial download of the metrics may take a while.