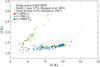
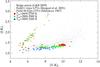
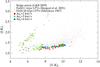
Fig. 7
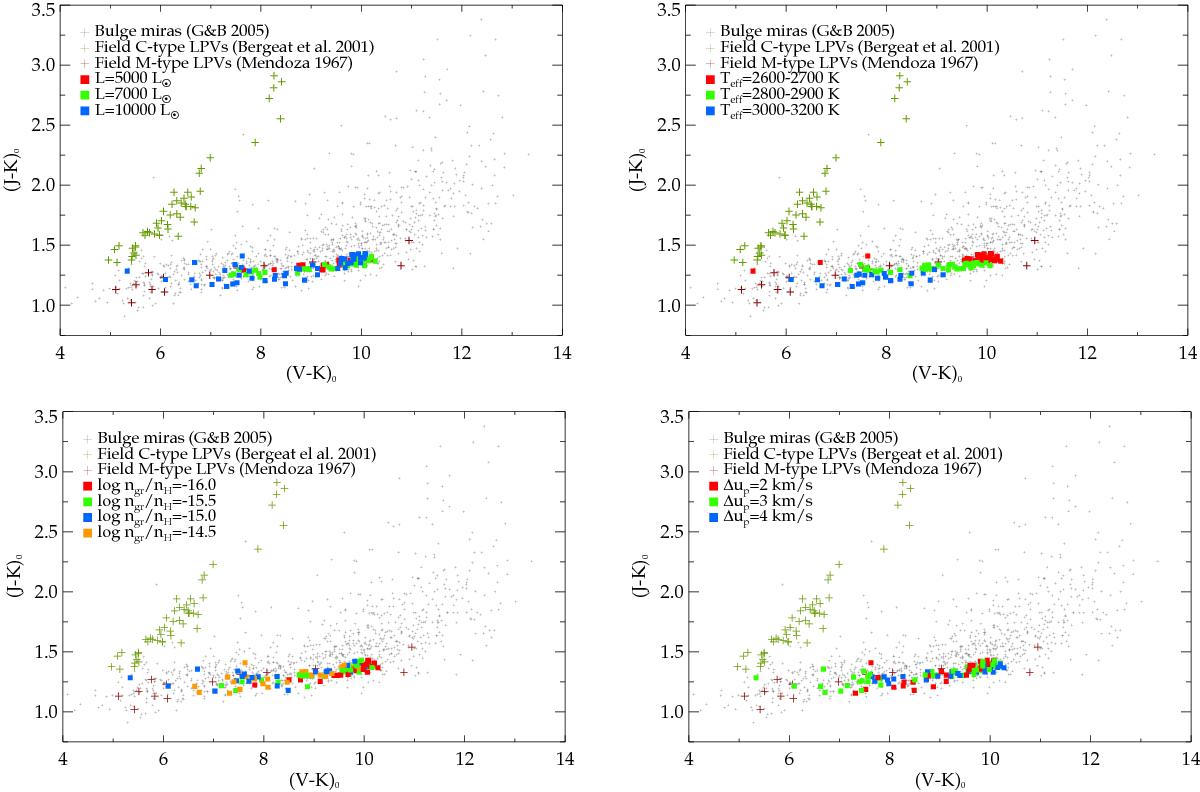
Observed and mean synthetic colours (J − K) vs. (V − K). The observational data (plus signs) is compiled from different sources: Galactic Bulge miras (Groenewegen & Blommaert, 2005, grey), field M-type LPVs (Mendoza, 1967, red), and C-rich giants (Bergeat et al., 2001, green). The model data (filled squares) is from models which develop a wind, as indicated in red in Fig. 1. All panels show the same data but with different colour coding according to stellar luminosity (upper left), effective temperature (upper right), seed particle abundance (lower left) and piston velocity (lower right). The stellar mass is one solar mass for all models. Most of the observational data are single epoch measurements, whereas the synthetic colours are means over the pulsation cycle.
Current usage metrics show cumulative count of Article Views (full-text article views including HTML views, PDF and ePub downloads, according to the available data) and Abstracts Views on Vision4Press platform.
Data correspond to usage on the plateform after 2015. The current usage metrics is available 48-96 hours after online publication and is updated daily on week days.
Initial download of the metrics may take a while.