Fig. 6
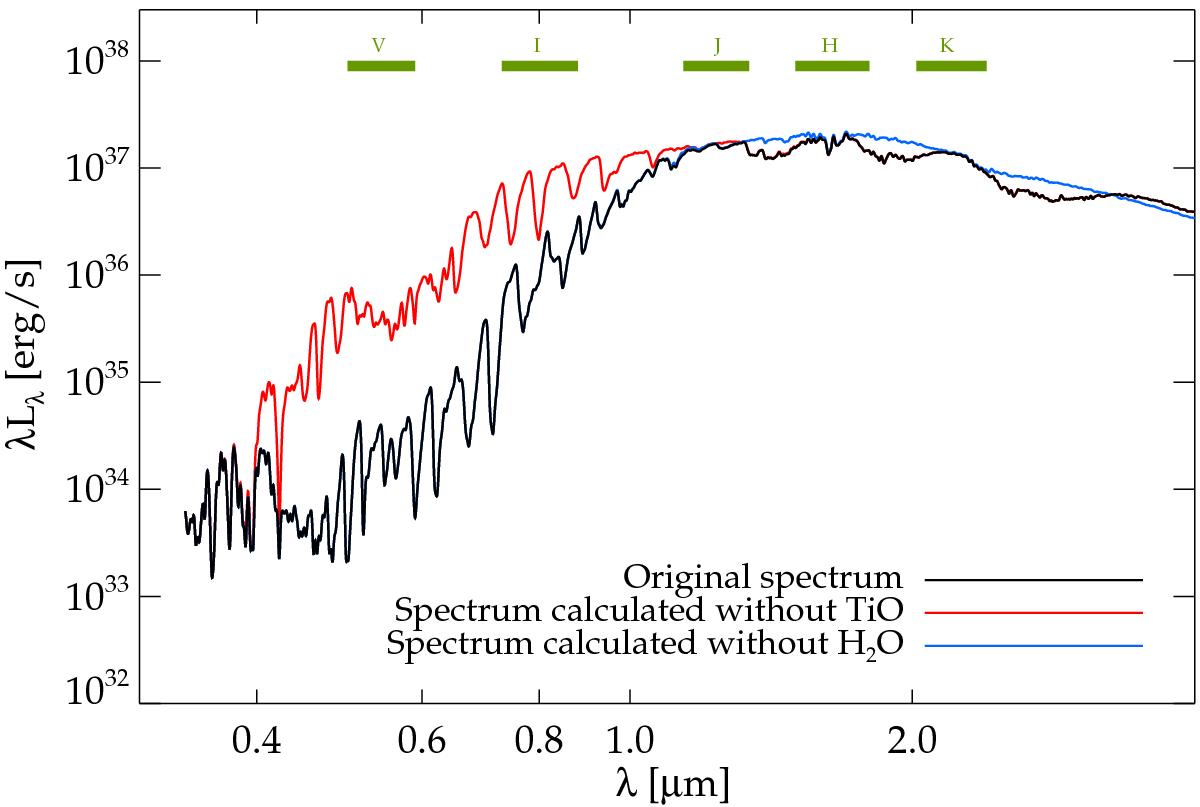
Spectral energy distribution as a function of wavelength for a model with input parameters M = 1 M⊙, L = 5000 L⊙, T∗ = 2800 K, up = 4 km s-1, and log ngr/nH = 14.5. The original spectrum is shown in black and the coloured curves show spectra calculated without TiO opacities (red) and H2O opacities (blue), indicating which photometric bands will be affected by changes in the corresponding features.
Current usage metrics show cumulative count of Article Views (full-text article views including HTML views, PDF and ePub downloads, according to the available data) and Abstracts Views on Vision4Press platform.
Data correspond to usage on the plateform after 2015. The current usage metrics is available 48-96 hours after online publication and is updated daily on week days.
Initial download of the metrics may take a while.