Fig. 5
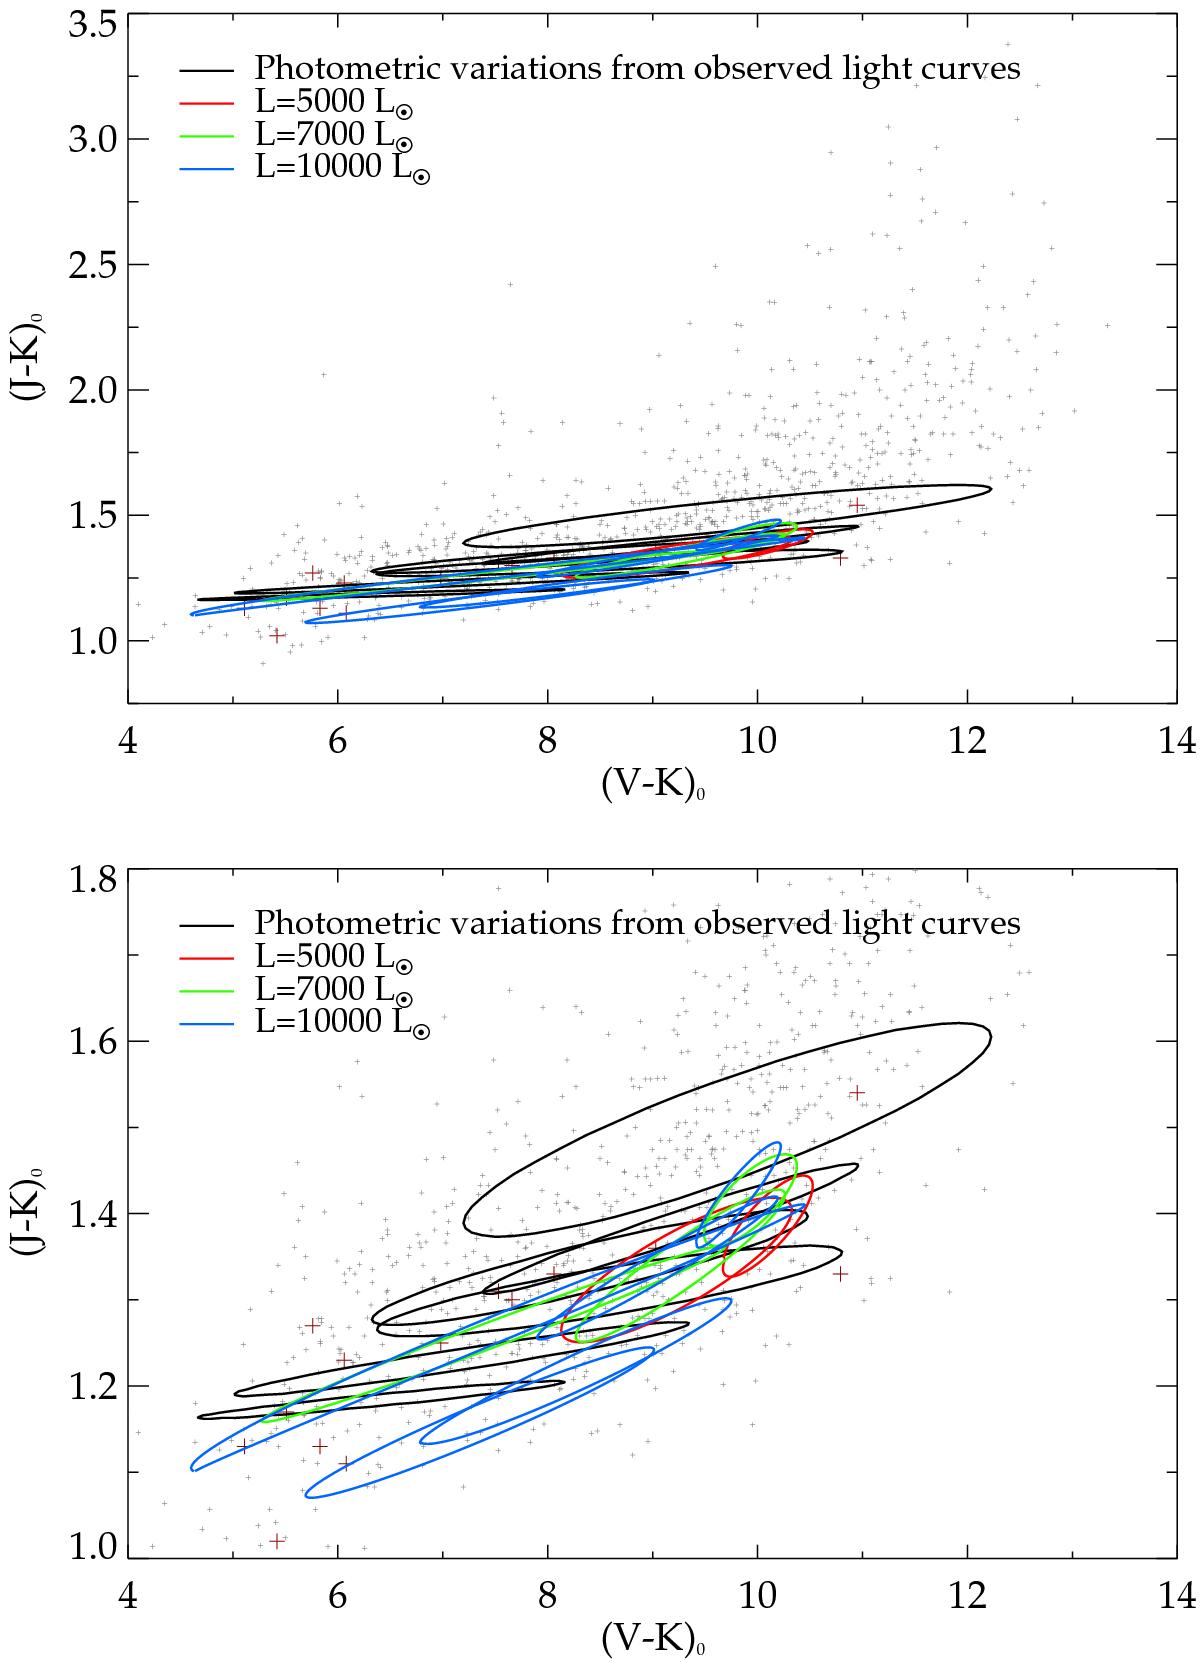
Photometric variations during a pulsation cycle in (J − K) vs. (V − K). The black loops show photometric variations derived from sine fits of observed light-curves for a set of M-type miras (R Car, R Hya, R Oct, R Vir, RR Sco, T Col and T Hor) and the coloured loops show synthetic photometric variation from a few selected models (see Table 2). For the observed miras we adopted photometric data in the visual from Eggen (1975) and Mendoza (1967) and complemented those with the near-IR data published by Whitelock et al. (2000). The synthetic loops are calculated from sine fits of the light-curves in the same way as the observational data. See Bladh et al. (2013) for more details concerning the sinefit of observed light curves. The bottom panel shows the same data as the top panel, but zoomed in. The observations in grey (plus signs) are presented in Fig. 7.
Current usage metrics show cumulative count of Article Views (full-text article views including HTML views, PDF and ePub downloads, according to the available data) and Abstracts Views on Vision4Press platform.
Data correspond to usage on the plateform after 2015. The current usage metrics is available 48-96 hours after online publication and is updated daily on week days.
Initial download of the metrics may take a while.