Fig. 14
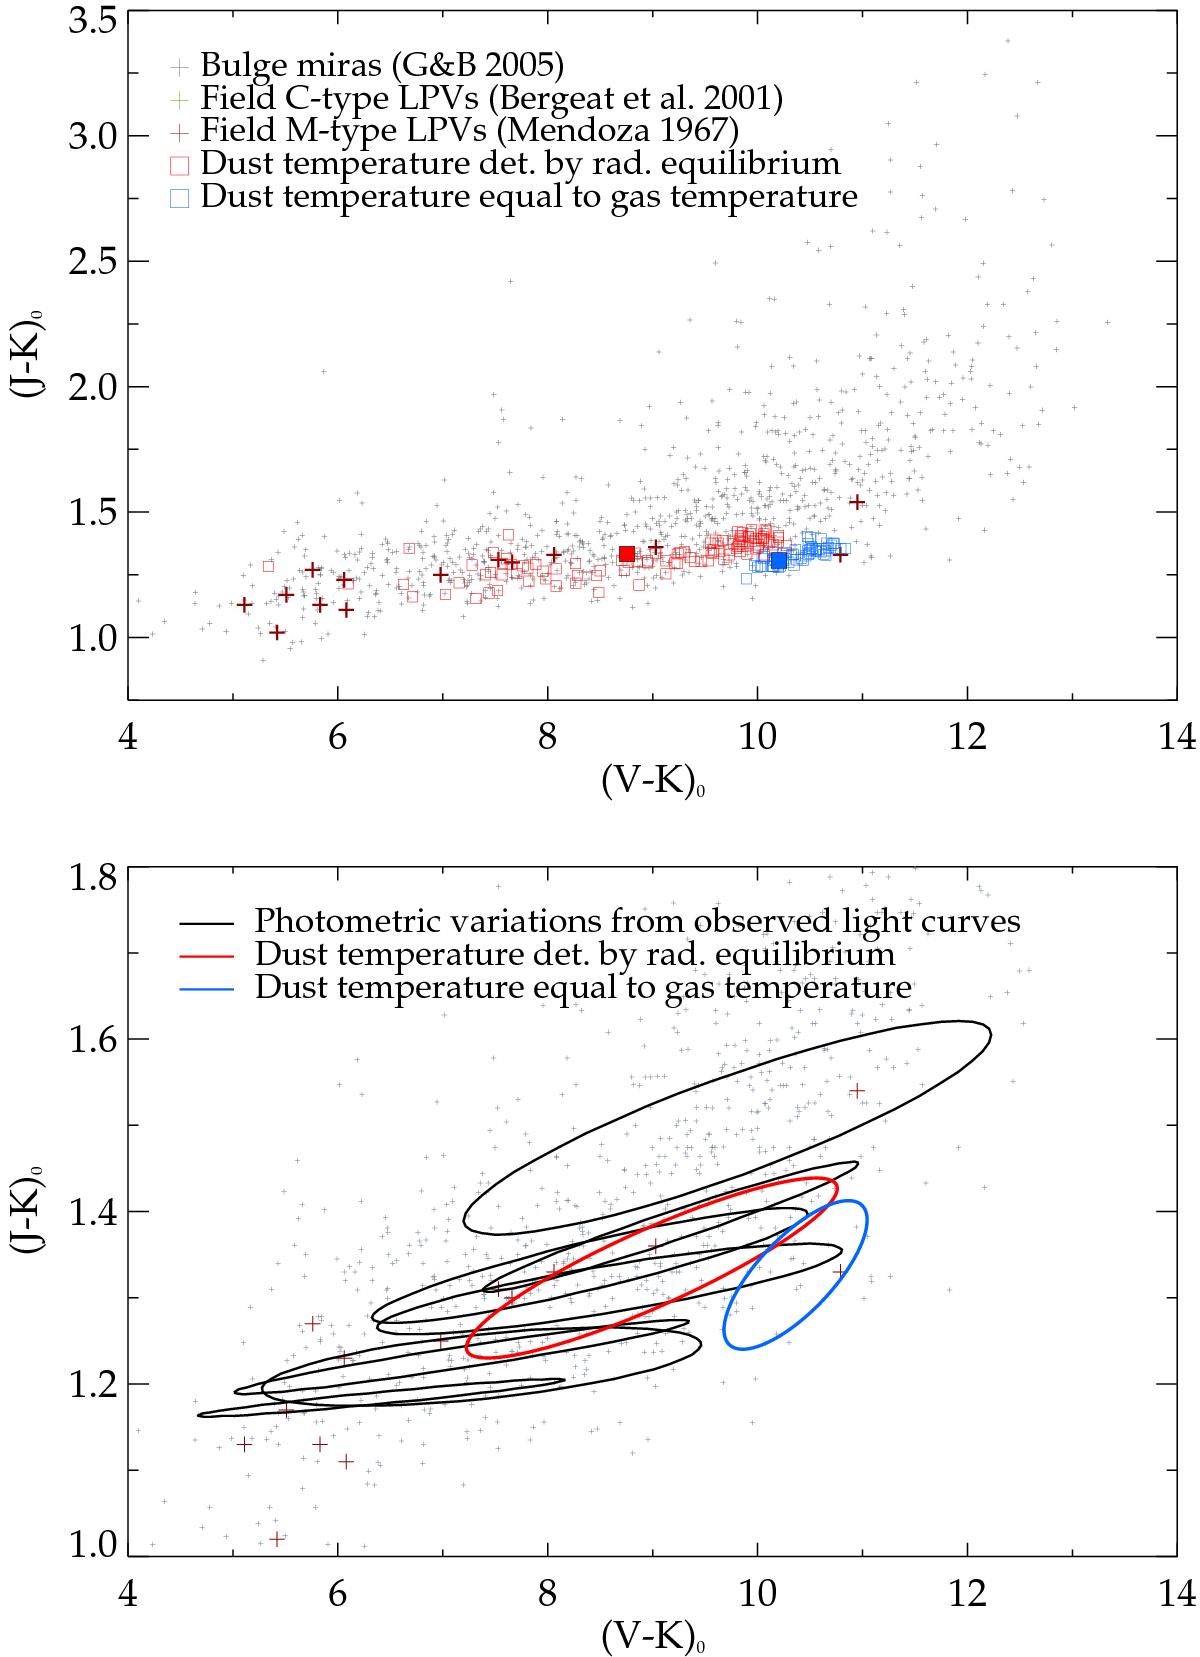
Observed and synthetic visual and near-IR colours. Top panel: synthetic phase-averaged colours from wind models where the dust temperature is determined by radiative processes (red squares) and the gas temperature (blue squares). Bottom panel: photometric variations derived from sine fits of observed light-curves for a sample set of M-type miras. The synthetic photometric variations for the models marked with filled squares (M = 1 M⊙, L = 5000 L⊙, T∗ = 2800 K, up = 4 km s-1 and log ngr/nH = −15) in the top panel are also plotted (solid red and blue loops). The colours are calculated from sine fits of light-curves, same as for the observational data. See Bladh et al. (2013) for more details concerning the sine-fit of observed light curves. For details on the observational data see Fig. 5.
Current usage metrics show cumulative count of Article Views (full-text article views including HTML views, PDF and ePub downloads, according to the available data) and Abstracts Views on Vision4Press platform.
Data correspond to usage on the plateform after 2015. The current usage metrics is available 48-96 hours after online publication and is updated daily on week days.
Initial download of the metrics may take a while.