Fig. 12
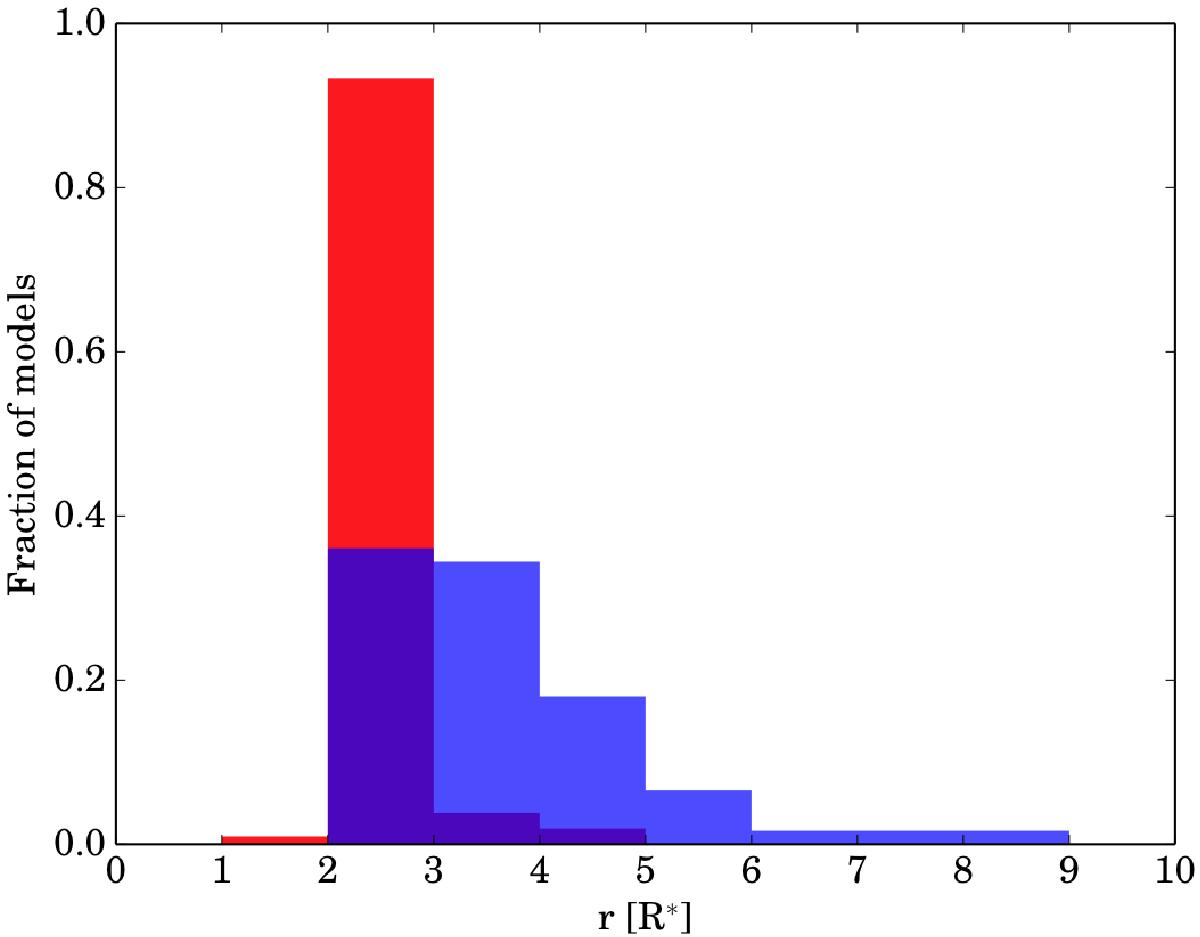
Position of the onset of outflow for all models developing a wind, averaged over the pulsation cycle. The red and blue areas represent models where the grain temperature is determined by radiative equilibrium and models where the grain temperature is set equal to the gas temperature, respectively. The purple area is where the two types of models overlap.
Current usage metrics show cumulative count of Article Views (full-text article views including HTML views, PDF and ePub downloads, according to the available data) and Abstracts Views on Vision4Press platform.
Data correspond to usage on the plateform after 2015. The current usage metrics is available 48-96 hours after online publication and is updated daily on week days.
Initial download of the metrics may take a while.