Fig. 11
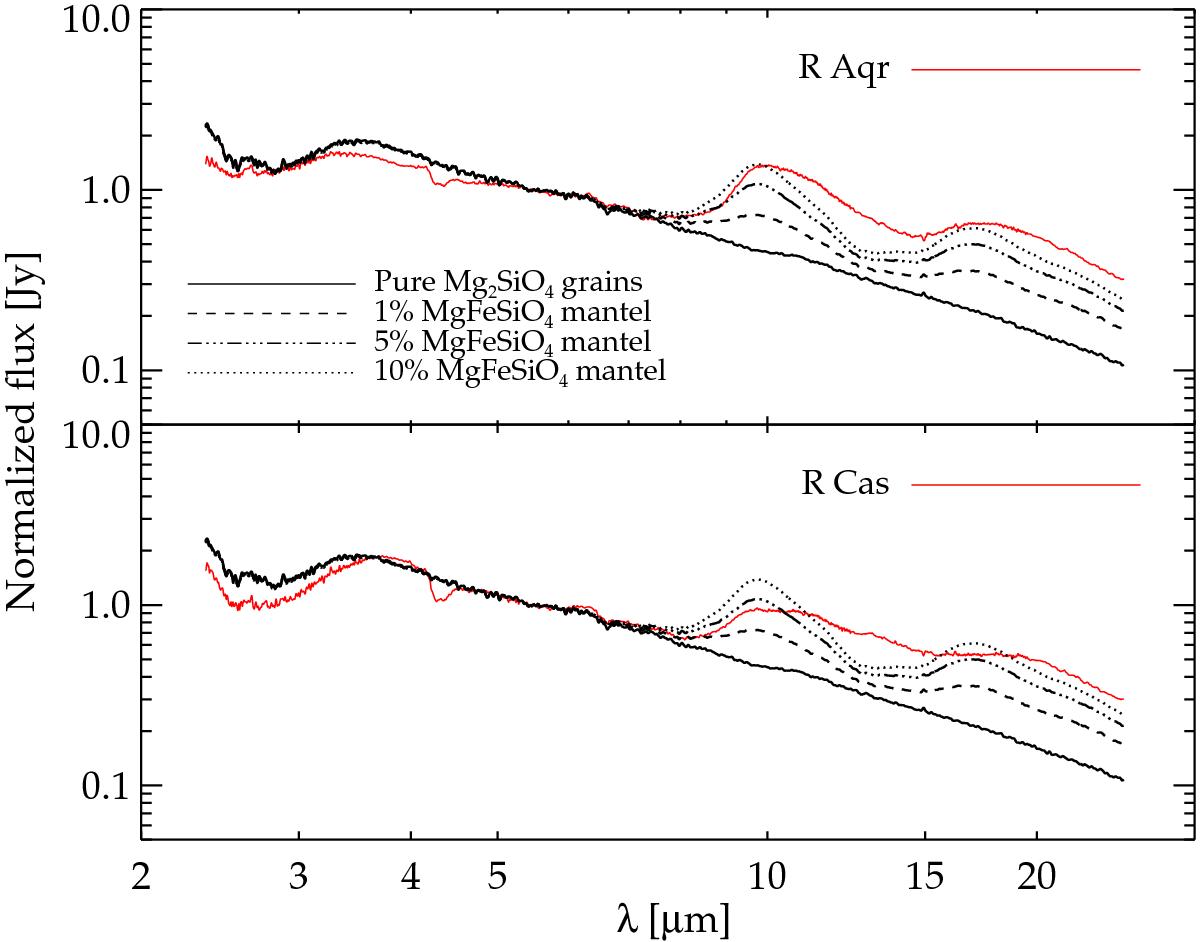
Spectral energy distribution as a function of wavelength. The red curves shows the observed ISO/SWS spectra of R Aqr and R Cas (Kraemer et al., 2002; Sloan et al., 2003). The black solid curve shows the spectra from a dynamical model using pure Mg2SiO4 grains and the grey curves show the spectra when assuming a core of Mg2SiO4 and a mantle of MgFeSiO4 in the a posteriori spectral calculations. The dashed, dot-dashed and dotted lines show the spectra setting the mantle size to 1%, 5% and 10% of the grain radius, respectively.
Current usage metrics show cumulative count of Article Views (full-text article views including HTML views, PDF and ePub downloads, according to the available data) and Abstracts Views on Vision4Press platform.
Data correspond to usage on the plateform after 2015. The current usage metrics is available 48-96 hours after online publication and is updated daily on week days.
Initial download of the metrics may take a while.