Fig. 10
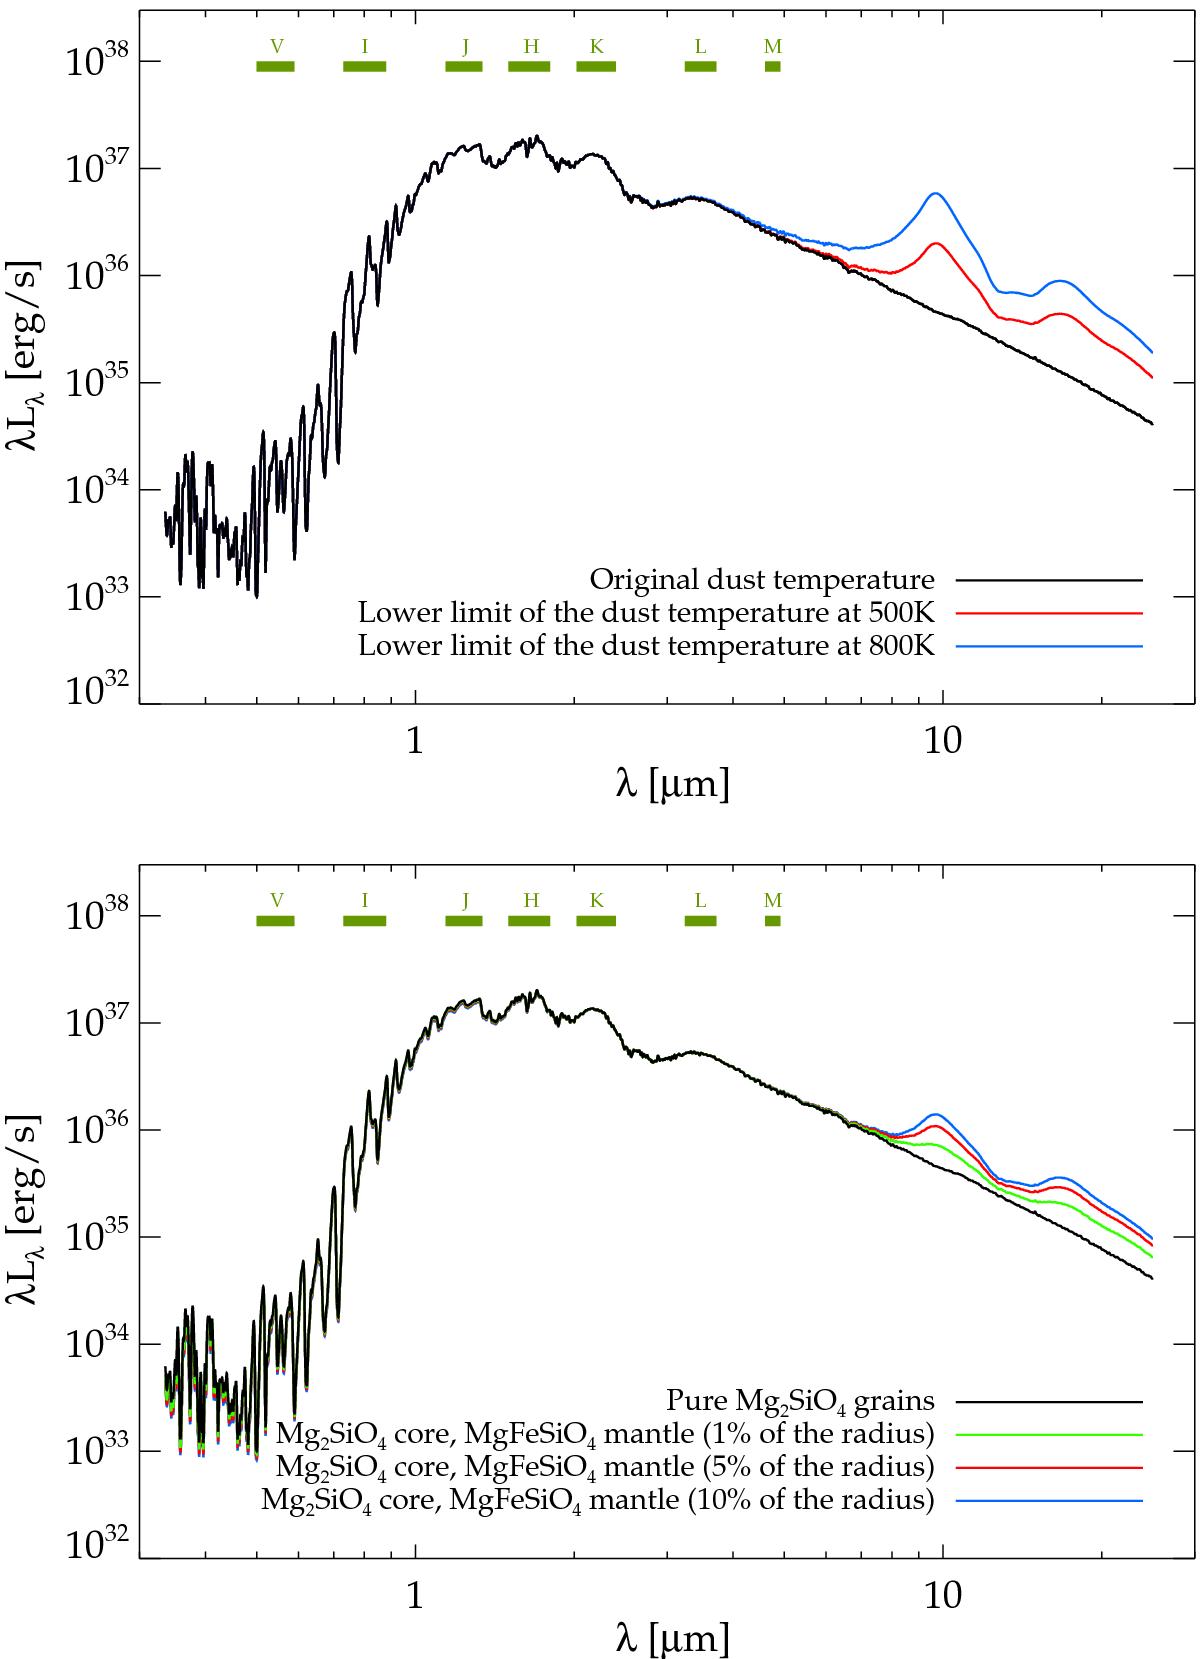
Spectral energy distributions as a function of wavelength resulting from the dust temperatures indicated in Fig. 9. The black curve shows the original spectrum for a dynamical model with pure Mg2SiO4 grains (M = 1 M⊙, L = 5000 L⊙ and T∗ = 2800 K). Top panel: the spectra produced when setting a minimum grain temperature of 800 K (blue) and 500 K (red) for the pure Mg2SiO4 grains, i.e. using the temperature structure in the top panel of Fig. 9. Bottom panel: the spectra produced when using a core of Mg2SiO4 and a mantle of MgFeSiO4. The green, red and blue lines show the spectra for a mantle size of 1%, 5% and 10% of the radius, respectively. The corresponding temperature structures are shown in the lower panels of Fig. 9
Current usage metrics show cumulative count of Article Views (full-text article views including HTML views, PDF and ePub downloads, according to the available data) and Abstracts Views on Vision4Press platform.
Data correspond to usage on the plateform after 2015. The current usage metrics is available 48-96 hours after online publication and is updated daily on week days.
Initial download of the metrics may take a while.