Fig. 3
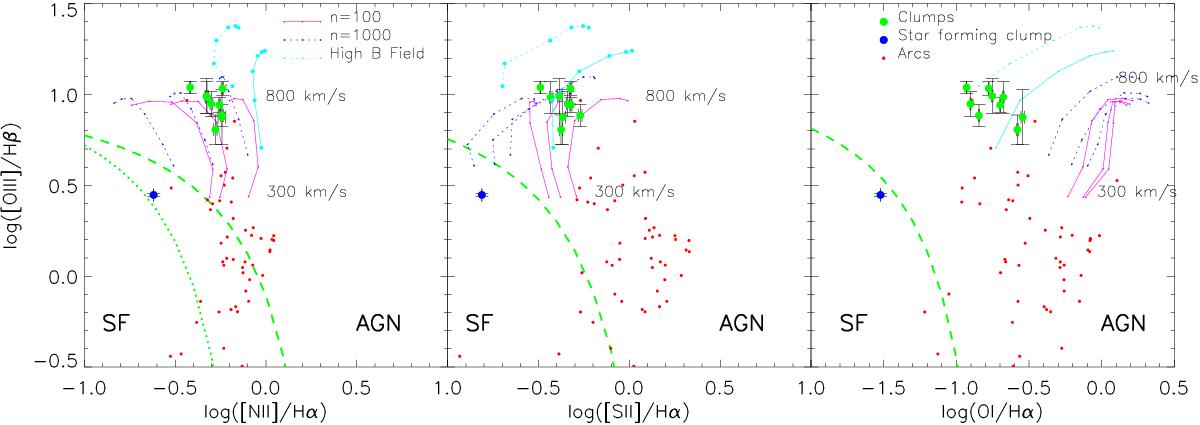
Key diagnostics of the reddening–insensitive line ratios for the clumps (circles) and arcs (points). The dotted line represents the empirical separation of star formation and AGN-ionised regions, the dashed lines show the extreme upper limit possible for star formation (Kewley et al. 2006). Shock models from Allen et al. (2008) are shown for 2 densities n = 100 (purple) and 1000 (blue) cm-3 at 3 standard magnetic field strengths (B = 0.1, 1, 5 and 10, 32, 100 μG, respectively, from left to right in the first and second panel and right to left in the third panel) and one high magnetic field strength (B = 0.1 and 1 mG). The clumps and arcs are clearly seperated in this plot, indicating that they are energetically distinct objects. The excitation of the clumps cannot be fully explained by shocks because they are too low in [OI] relative to the [OIII] flux.
Current usage metrics show cumulative count of Article Views (full-text article views including HTML views, PDF and ePub downloads, according to the available data) and Abstracts Views on Vision4Press platform.
Data correspond to usage on the plateform after 2015. The current usage metrics is available 48-96 hours after online publication and is updated daily on week days.
Initial download of the metrics may take a while.