Fig. 2
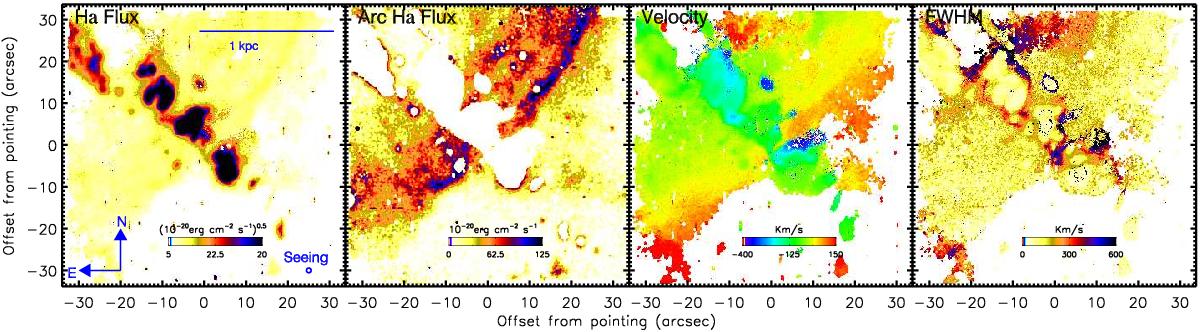
Left: integrated Hα flux map scaled to emphasize the clumpy structure of the inner filament. Centre left: Hα flux map after the clumps of the inner filament have been subtracted to show the structure of the arcs. Centre right: velocity structure of the Hα – [NII] complex. Right: FWHM of the Hα emission showing regions of increased line width surounding the clumps. The FWHM map shows that the linewidth is broadened at the edges of the clumps up to 400−600 km s-1, suggesting that the gas here may be shocked.
Current usage metrics show cumulative count of Article Views (full-text article views including HTML views, PDF and ePub downloads, according to the available data) and Abstracts Views on Vision4Press platform.
Data correspond to usage on the plateform after 2015. The current usage metrics is available 48-96 hours after online publication and is updated daily on week days.
Initial download of the metrics may take a while.