Free Access
Fig. 1
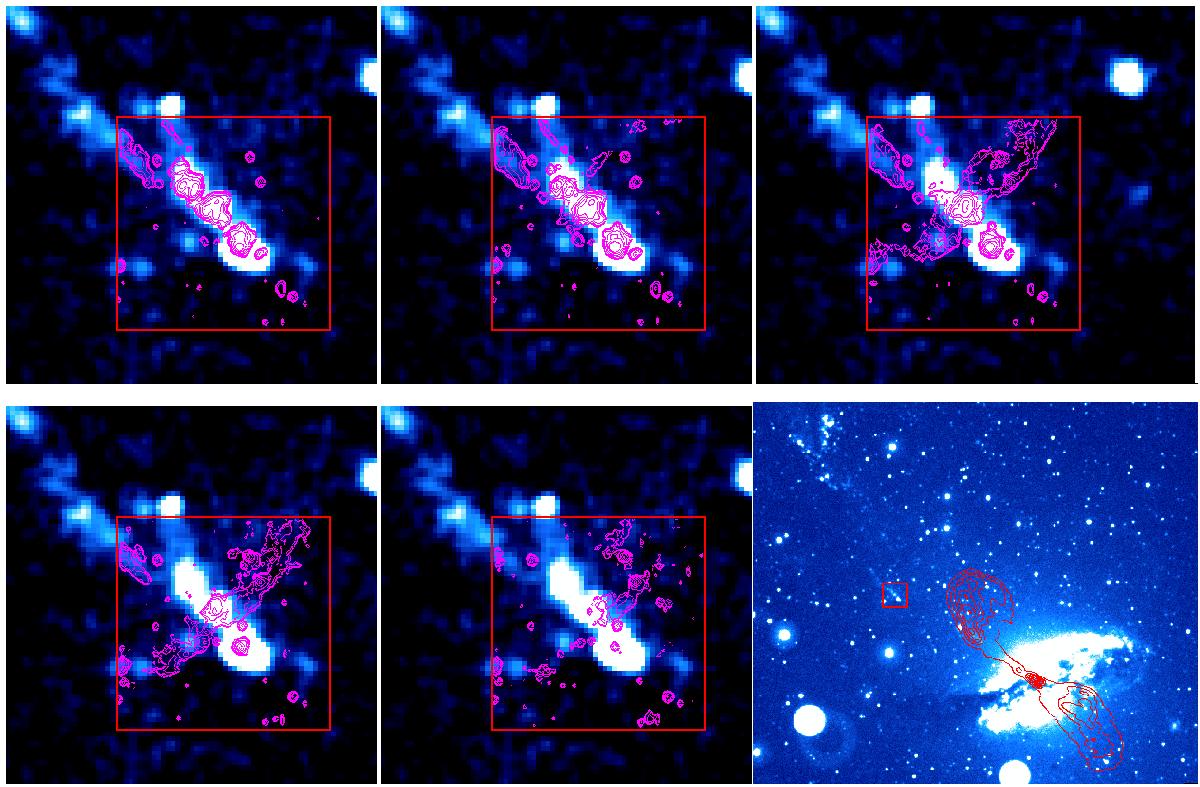
Hα channel map contours with panels centred at wavelengths from 6575 to 6563 Å at an interval of 1.5 Å (~60 km s-1) from left to right, top to bottom, overlaid on GALEX FUV images. Panel 6 is a wider view of the NUV image together with 21 cm VLA radio-continuum contours in red. The red rectangle indicates the FOV of MUSE.
Current usage metrics show cumulative count of Article Views (full-text article views including HTML views, PDF and ePub downloads, according to the available data) and Abstracts Views on Vision4Press platform.
Data correspond to usage on the plateform after 2015. The current usage metrics is available 48-96 hours after online publication and is updated daily on week days.
Initial download of the metrics may take a while.