Fig. 9
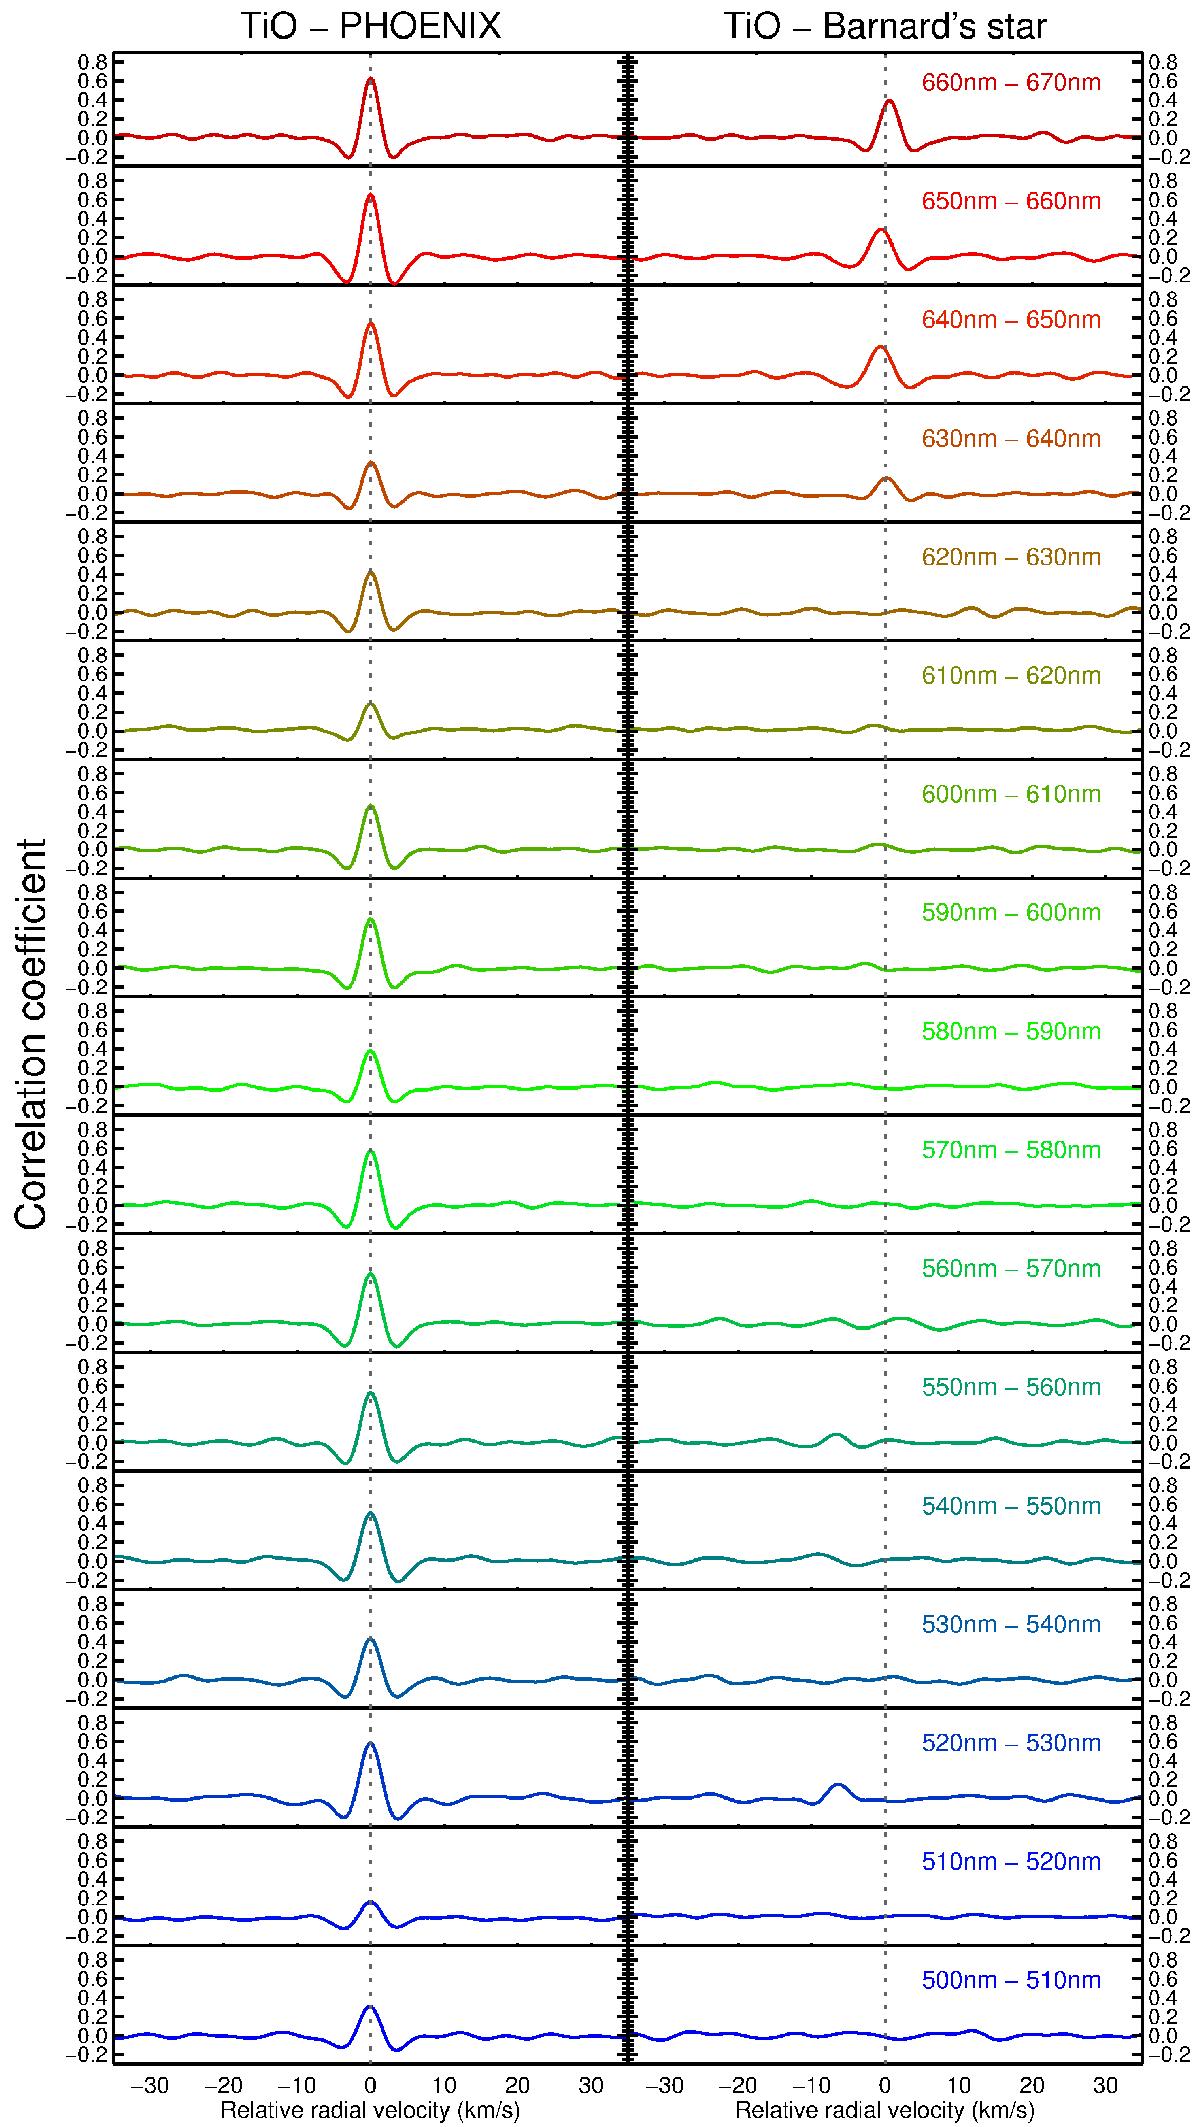
Cross-correlation of sections of the TiO template with the PHOENIX model (left column) and with the Barnard’s star spectrum (right column), at different wavelengths. The TiO template correlates strongly almost everywhere between 500 nm and 670 nm, while the correlation between the template and the TiO-dominated spectrum of Barnard’s star is absent across most of the wavelength range, and less than 0.4 in the best case. We also note that maximum correlation occurs at slightly different radial velocities (an extreme feature is observed between 520 nm and 530 nm). This is explicitly indicative of wavelength-offsets of entire TiO bands (and thus inaccuracies in the determination of the energy levels of the TiO molecule).
Current usage metrics show cumulative count of Article Views (full-text article views including HTML views, PDF and ePub downloads, according to the available data) and Abstracts Views on Vision4Press platform.
Data correspond to usage on the plateform after 2015. The current usage metrics is available 48-96 hours after online publication and is updated daily on week days.
Initial download of the metrics may take a while.