Fig. 3
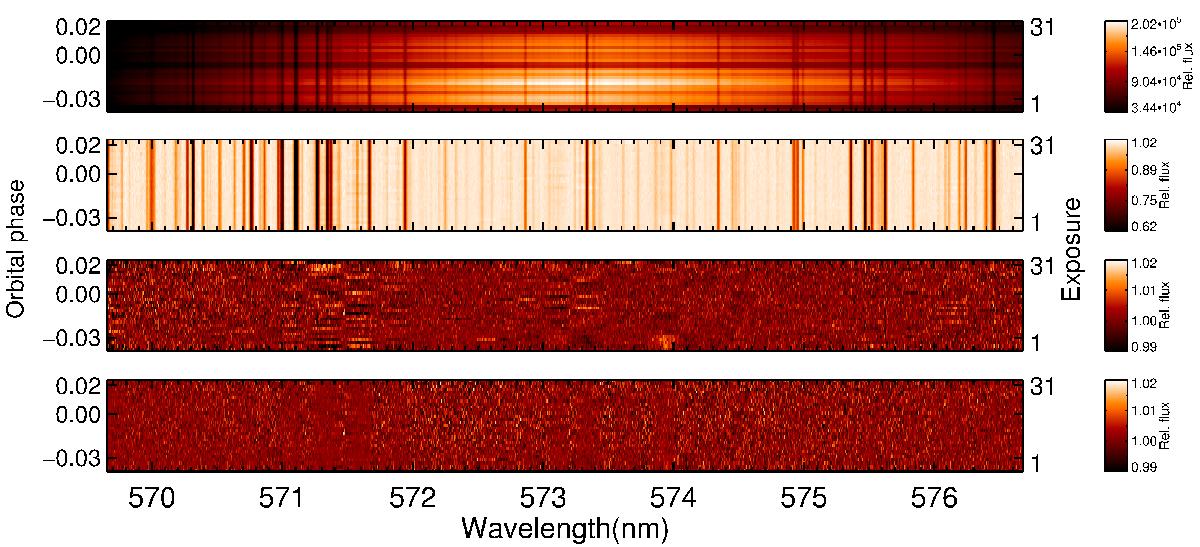
Major post processing steps of echelle order 17 before cross-correlation. The top panel: shows the initial state of the spectral order, arranged such that all exposures in this order are stacked vertically. The result of the removal of the blaze pattern and the alignment of the individual exposures (which cannot be seen by eye because the misalignments are on a sub-pixel level) is shown in the second panel. Third panel: residuals after dividing through the time-averaged spectrum (i.e. the average of the spectrum obtained by averaging each column in the second panel). Fourth panel: same residuals after removing 4σ outliers, removing latent broadband features and weighing down noisy columns. The average standard deviation of the residuals at this stage is 0.45%. Only the lower two panels are scaled to the same colour range.
Current usage metrics show cumulative count of Article Views (full-text article views including HTML views, PDF and ePub downloads, according to the available data) and Abstracts Views on Vision4Press platform.
Data correspond to usage on the plateform after 2015. The current usage metrics is available 48-96 hours after online publication and is updated daily on week days.
Initial download of the metrics may take a while.