Fig. 9
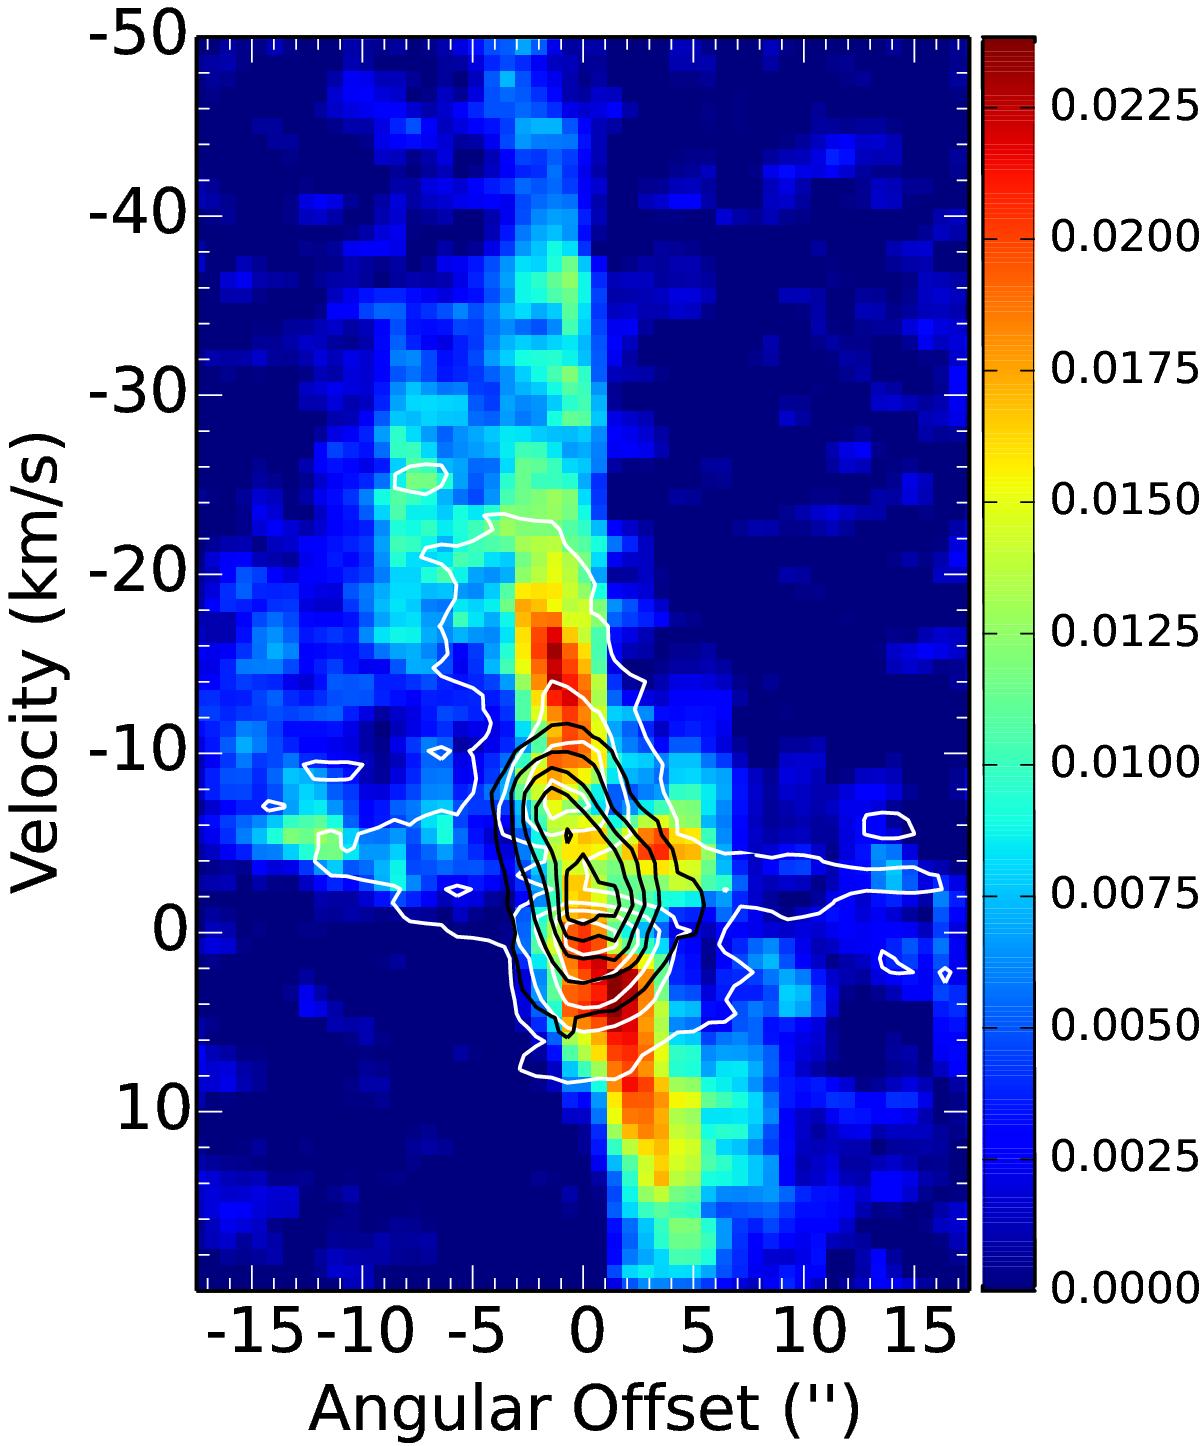
SiO (colour scale), CS (white contours) and H2CO (black contours) position-velocity diagram for a cut along the grey line shown in Figs. 2 and 5. The units of the colour scale are Jy/beam, and the contours of the CS and H2CO emission correspond to 10% to 90% of the peak value, in steps of 20%. The SiO emission in particular shows both high and low velocity components, while the CS traces an arc with both high and low velocity gas. These patterns are best seen in the blue shifted material.
Current usage metrics show cumulative count of Article Views (full-text article views including HTML views, PDF and ePub downloads, according to the available data) and Abstracts Views on Vision4Press platform.
Data correspond to usage on the plateform after 2015. The current usage metrics is available 48-96 hours after online publication and is updated daily on week days.
Initial download of the metrics may take a while.