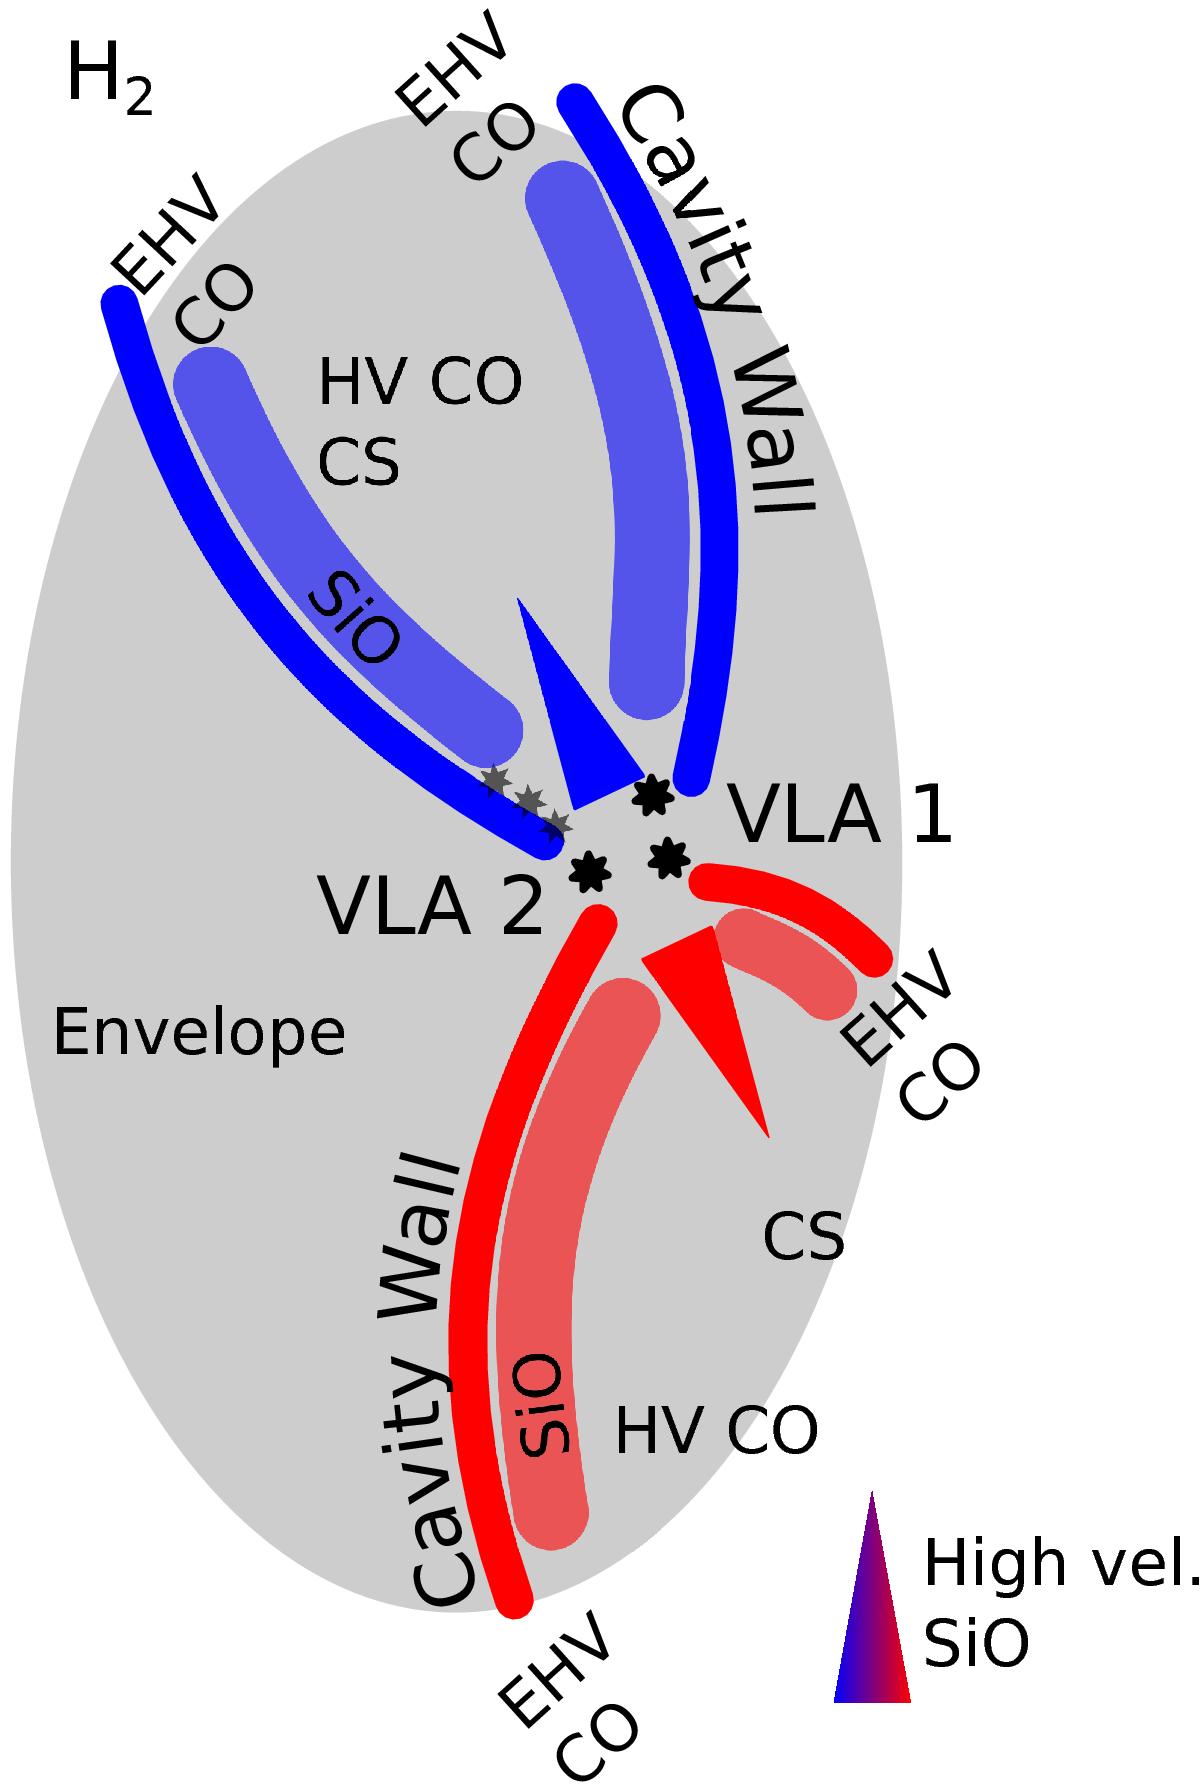
Fig. 7

Cartoon of the IRAS 17233 outflow, as it appears on the sky. The black stars in the centre of the outflow show the approximate positions of VLA2a, VLA1a and VLA1b, while the smaller (grey) stars show the positions of VLA 2b-d. The cones at the centre of the figure show the high velocity SiO component, while the wide lines within the cavity wall show the low velocity SiO emission component. The regions of EHV and HV CO, as well as general CS emission are labelled, and the envelope through which the outflow is expanding is shown with a grey oval. Note that the ends of the outflow extend further than the envelope, explaining the presence of EHV CO at the ends of the outflowing structure. The presence of an H2 emission feature to the North of the outflow is also depicted here.
Current usage metrics show cumulative count of Article Views (full-text article views including HTML views, PDF and ePub downloads, according to the available data) and Abstracts Views on Vision4Press platform.
Data correspond to usage on the plateform after 2015. The current usage metrics is available 48-96 hours after online publication and is updated daily on week days.
Initial download of the metrics may take a while.


