Fig. 6
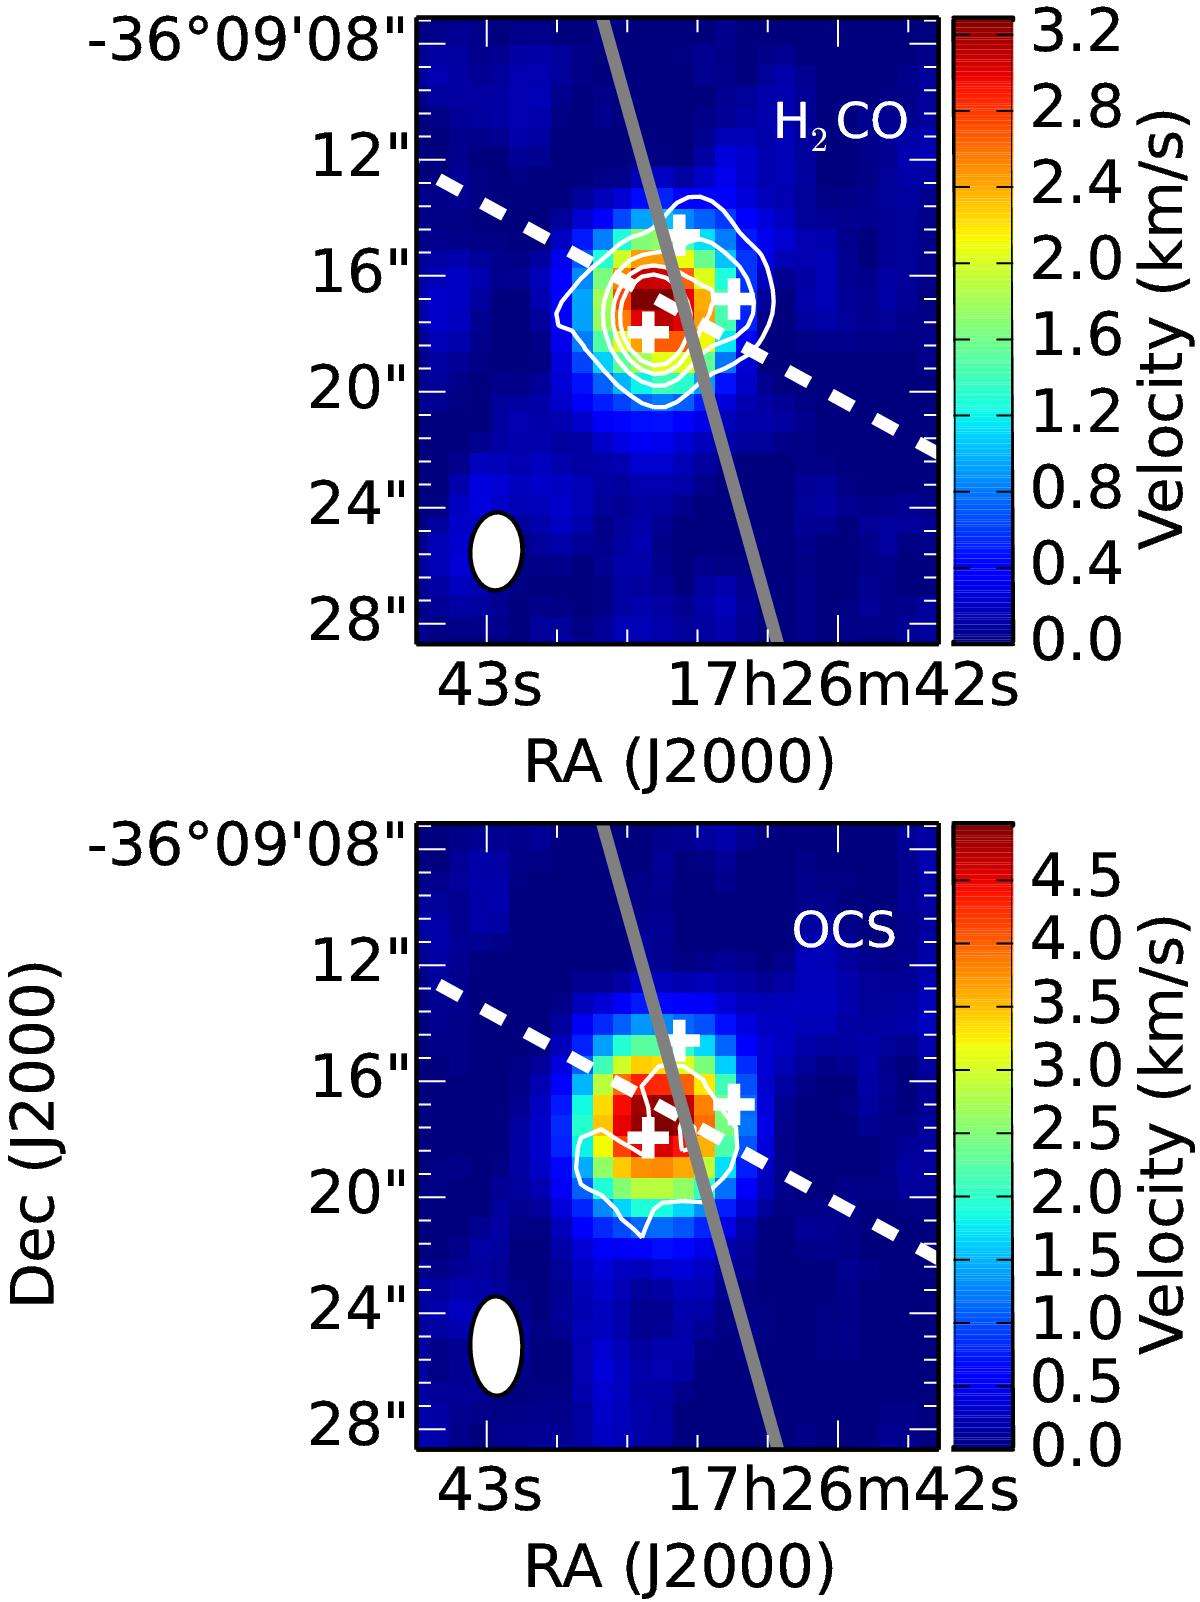
Integrated intensity (zeroth moment) maps of the OCS and H2CO emission observed towards VLA 2a, VLA1a and VLA1b (white crosses). In the H2CO plot, the contours show the 10, 20, 30, and 40σ contours of the 48 GHz continuum emission, while in the OCS plot, they show the 3 and 6σ contours of the O13CS emission. The solid grey line shows the position angle of the outflow as outlined in Fig. 2, and the dashed white line shows the direction of the velocity gradients indicated here.
Current usage metrics show cumulative count of Article Views (full-text article views including HTML views, PDF and ePub downloads, according to the available data) and Abstracts Views on Vision4Press platform.
Data correspond to usage on the plateform after 2015. The current usage metrics is available 48-96 hours after online publication and is updated daily on week days.
Initial download of the metrics may take a while.