Fig. 2
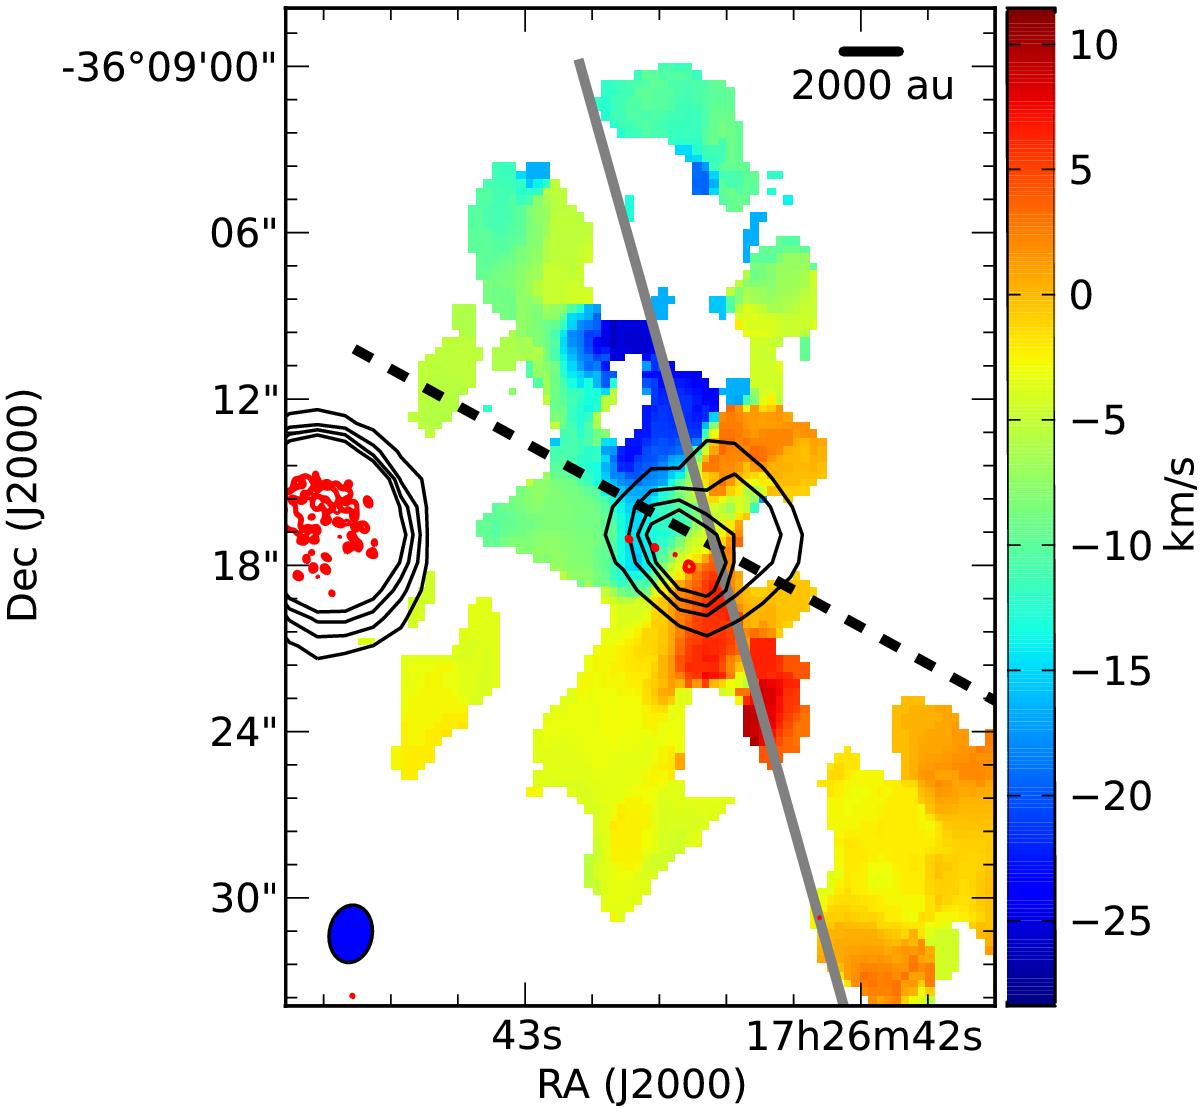
Intensity weighted velocity (first moment) map of the SiO emission coming from the VLA1-2 region. The black contours show the 48 GHz continuum emission at 10, 20, 30 and 40σ (σ = 0.37 mJy/beam). The red contours show the 1.3 cm emission starting at 5σ and continuing in 1σ intervals to 10σ. The red and black contours to the left show the VLA5 HII region. The solid grey and dashed black lines show the directions of the large scale outflow and small scale velocity gradients (respectively).
Current usage metrics show cumulative count of Article Views (full-text article views including HTML views, PDF and ePub downloads, according to the available data) and Abstracts Views on Vision4Press platform.
Data correspond to usage on the plateform after 2015. The current usage metrics is available 48-96 hours after online publication and is updated daily on week days.
Initial download of the metrics may take a while.