Fig. 1
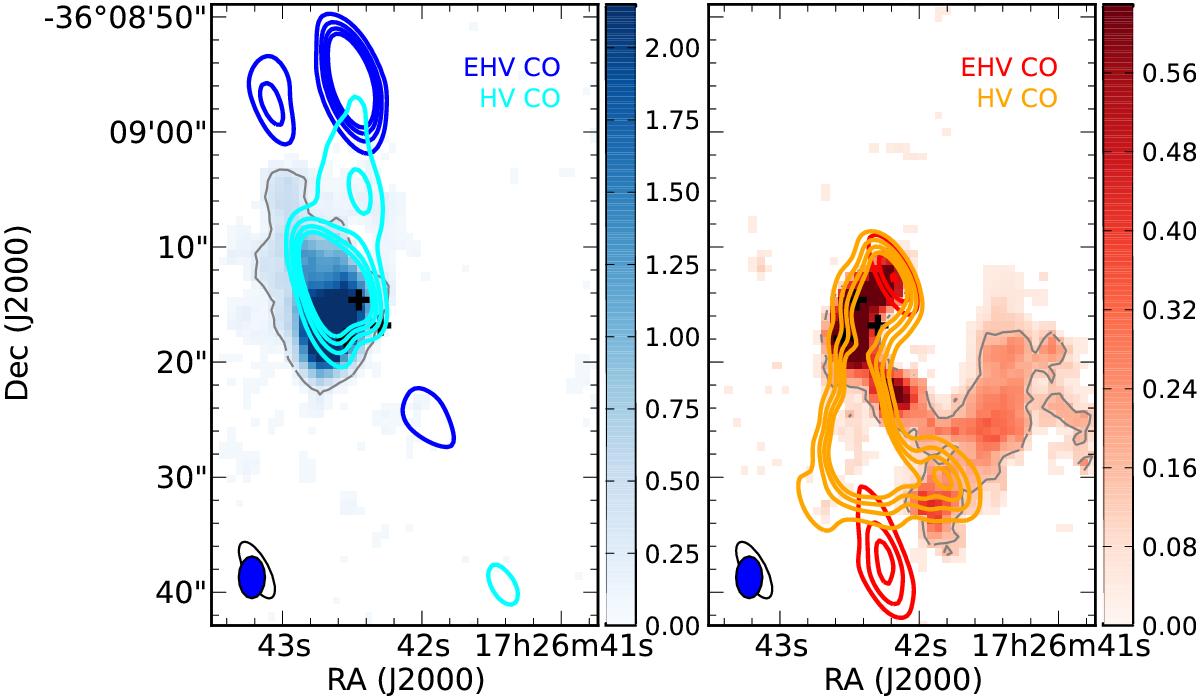
CS integrated intensity with contours of CO emission. Left: EHV blue shifted CO emission (blue contours) from Leurini et al. (2009) starting at 3σ and increasing at intervals of 3σ. The HV velocity blue shifted CO is shown in cyan contours starting at 5σ and increase at intervals of 5σ. Right: EHV red-shifted CO emission (red contours) from Leurini et al. (2009) starting at 3 σ and increasing at intervals of 3σ. The HV red shifted CO is shown in orange contours starting at 10σ and increase at intervals of 10σ. The colour scales show the blue and red shifted CS emission integrated over velocities greater than 4 km s-1 (red or blue shifted) with respect to the LSR velocity, and has units of Jy beam-1 km s-1. The thin grey contour shows the 3σ levels of the CS integrated intensities (4.6 × 10⁻² and 8.1 × 10⁻² Jy beam-1 km s-1 for red and blue respectively). The synthesised beams for the CS (blue, filled) and CO (black, open) observations are given in the bottom left corner of both panels. The units of the scale bars are Jy beam-1 km s-1.
Current usage metrics show cumulative count of Article Views (full-text article views including HTML views, PDF and ePub downloads, according to the available data) and Abstracts Views on Vision4Press platform.
Data correspond to usage on the plateform after 2015. The current usage metrics is available 48-96 hours after online publication and is updated daily on week days.
Initial download of the metrics may take a while.