Fig. 7
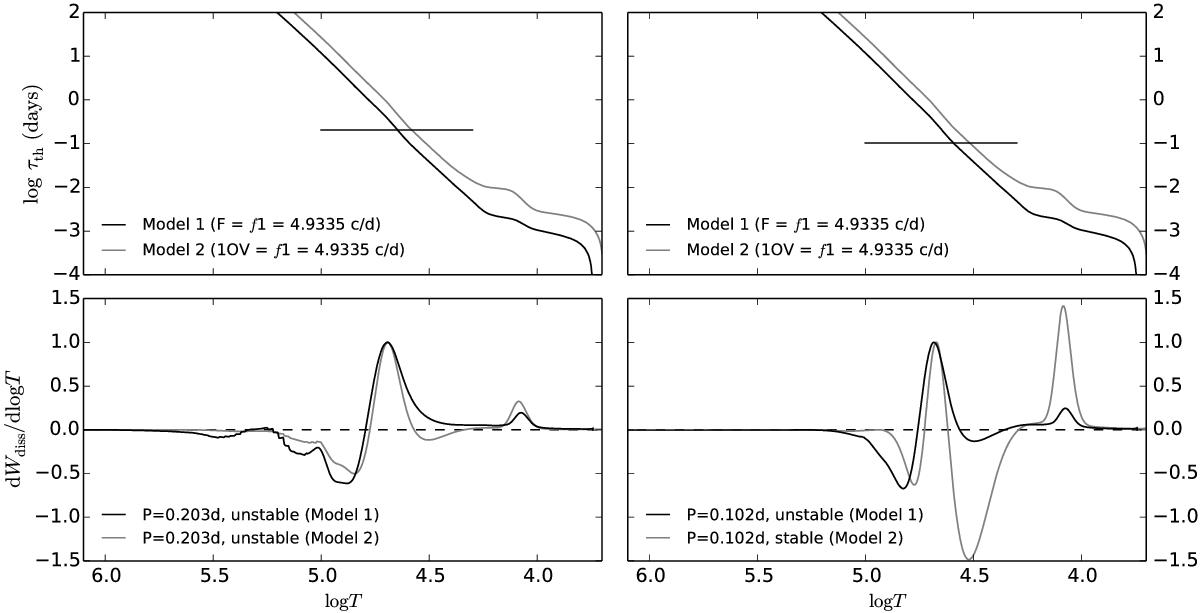
Upper panels: behavior of the local thermal timescale in a model which fits f1 as the radial fundamental (black line) and a model which fits f1 as the first radial overtone (grey line). The horizontal lines mark the periods of selected modes (0.203 d in the left panel and 0.102 d in the right panel). Lower panels: differential work integral for the corresponding modes in the envelopes of both models (positive in driving zones, negative in damping zones).
Current usage metrics show cumulative count of Article Views (full-text article views including HTML views, PDF and ePub downloads, according to the available data) and Abstracts Views on Vision4Press platform.
Data correspond to usage on the plateform after 2015. The current usage metrics is available 48-96 hours after online publication and is updated daily on week days.
Initial download of the metrics may take a while.