Fig. 1
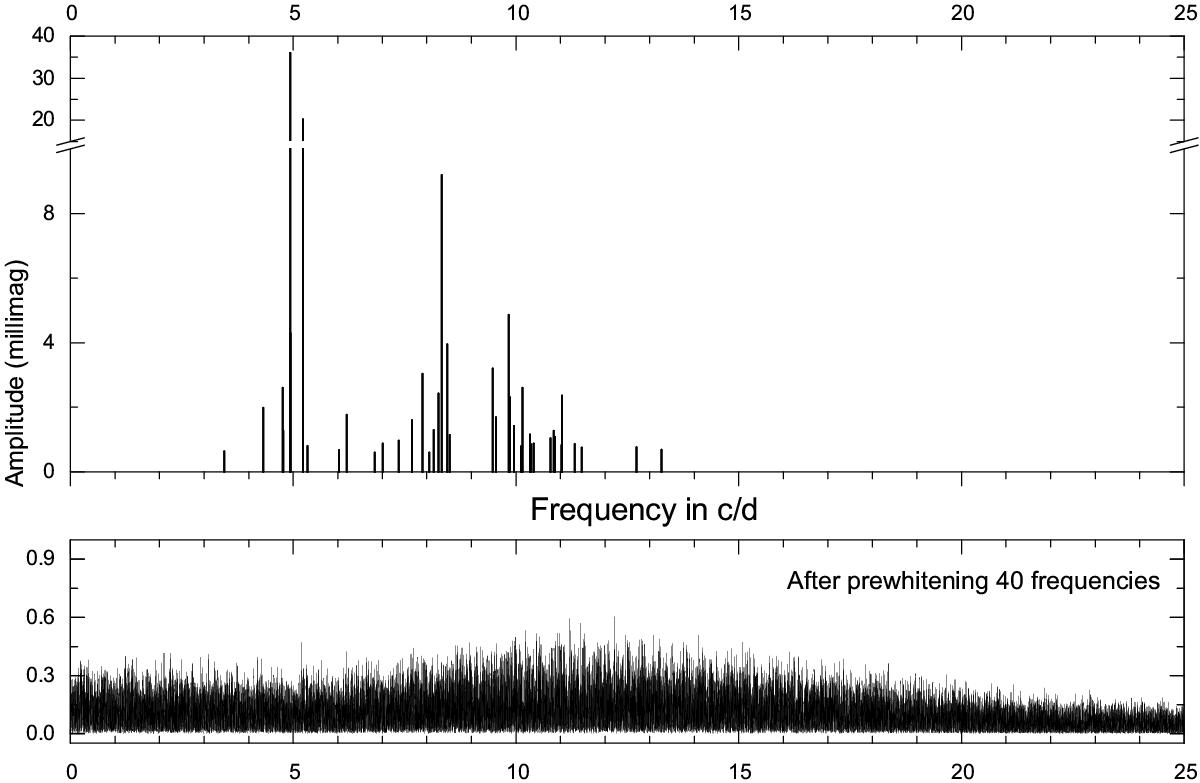
Top panel: distribution of detected significant frequencies of EE Cam. Bottom panel: Amplitude spectrum of the residuals after 40 frequencies are subtracted. This shows that many additional small-amplitude pulsation frequencies are present, especially near the previously detected and prewhitened high frequencies. These peaks have an amplitude signal/noise ratio under the limit of 4.0. For these peaks we cannot separate instrumental noise from effects of nearby pulsation modes and spurious peaks caused by undetected amplitude variability.
Current usage metrics show cumulative count of Article Views (full-text article views including HTML views, PDF and ePub downloads, according to the available data) and Abstracts Views on Vision4Press platform.
Data correspond to usage on the plateform after 2015. The current usage metrics is available 48-96 hours after online publication and is updated daily on week days.
Initial download of the metrics may take a while.