Fig. 4
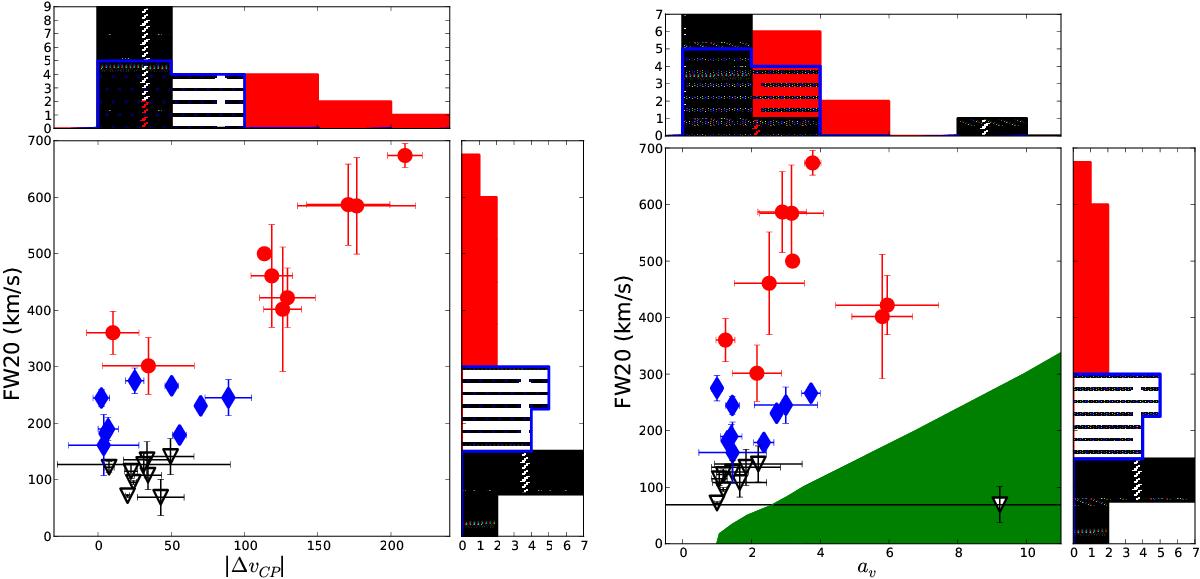
Left: asymmetry (| ΔvCP |) vs. FW20 distribution of the line profiles. Right: normalized asymmetry (av) vs. FW20 width distribution. The classification of the groups is based on the width regions from Fig. 3. Black triangles mark narrow lines with FW20< 200 km s-1, blue diamonds mark the middle width region with 200 km s-1<FW20< 300 km s-1and red circles indicate broad line detections with FW20> 300 km s-1. The green region shows the asymmetry values which cannot be measured because of the resolution of our spectra. In the histograms, the hatched region indicates narrow width profiles, the dotted hatched region marks intermediate lines while red bars mark broad lines.
Current usage metrics show cumulative count of Article Views (full-text article views including HTML views, PDF and ePub downloads, according to the available data) and Abstracts Views on Vision4Press platform.
Data correspond to usage on the plateform after 2015. The current usage metrics is available 48-96 hours after online publication and is updated daily on week days.
Initial download of the metrics may take a while.