Fig. 2
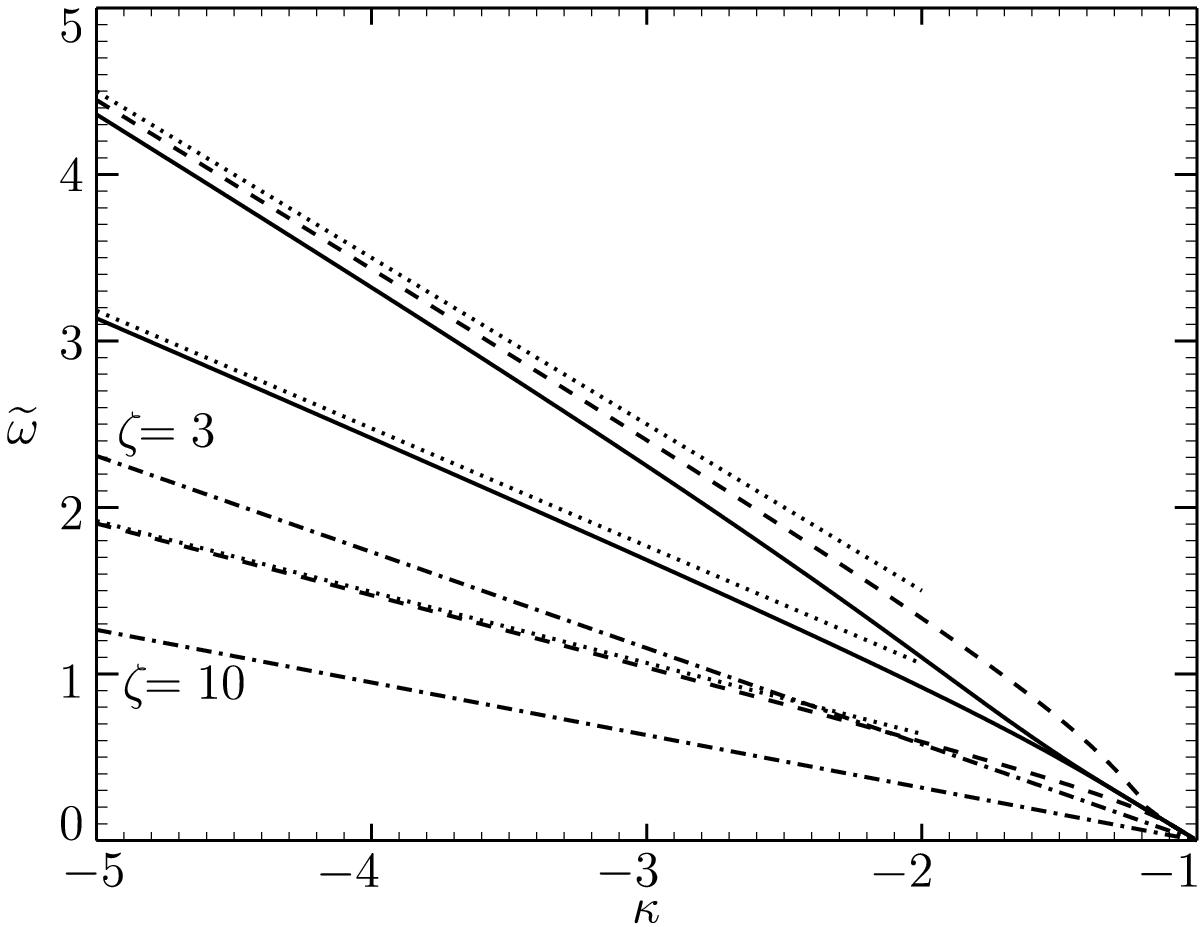
Dependence of the frequency ϖ of two modes on κ for κ< − 1. The solid and dashed lines correspond to ζ = 3 and ζ = 10. The lower dotted lines show the approximation given by Eq. (54), while the upper dotted line shows the approximation given by Eq. (57). The dashed-dotted lines are the graphs of function ![]() for ζ = 3 and ζ = 10.
for ζ = 3 and ζ = 10.
Current usage metrics show cumulative count of Article Views (full-text article views including HTML views, PDF and ePub downloads, according to the available data) and Abstracts Views on Vision4Press platform.
Data correspond to usage on the plateform after 2015. The current usage metrics is available 48-96 hours after online publication and is updated daily on week days.
Initial download of the metrics may take a while.