Fig. 7
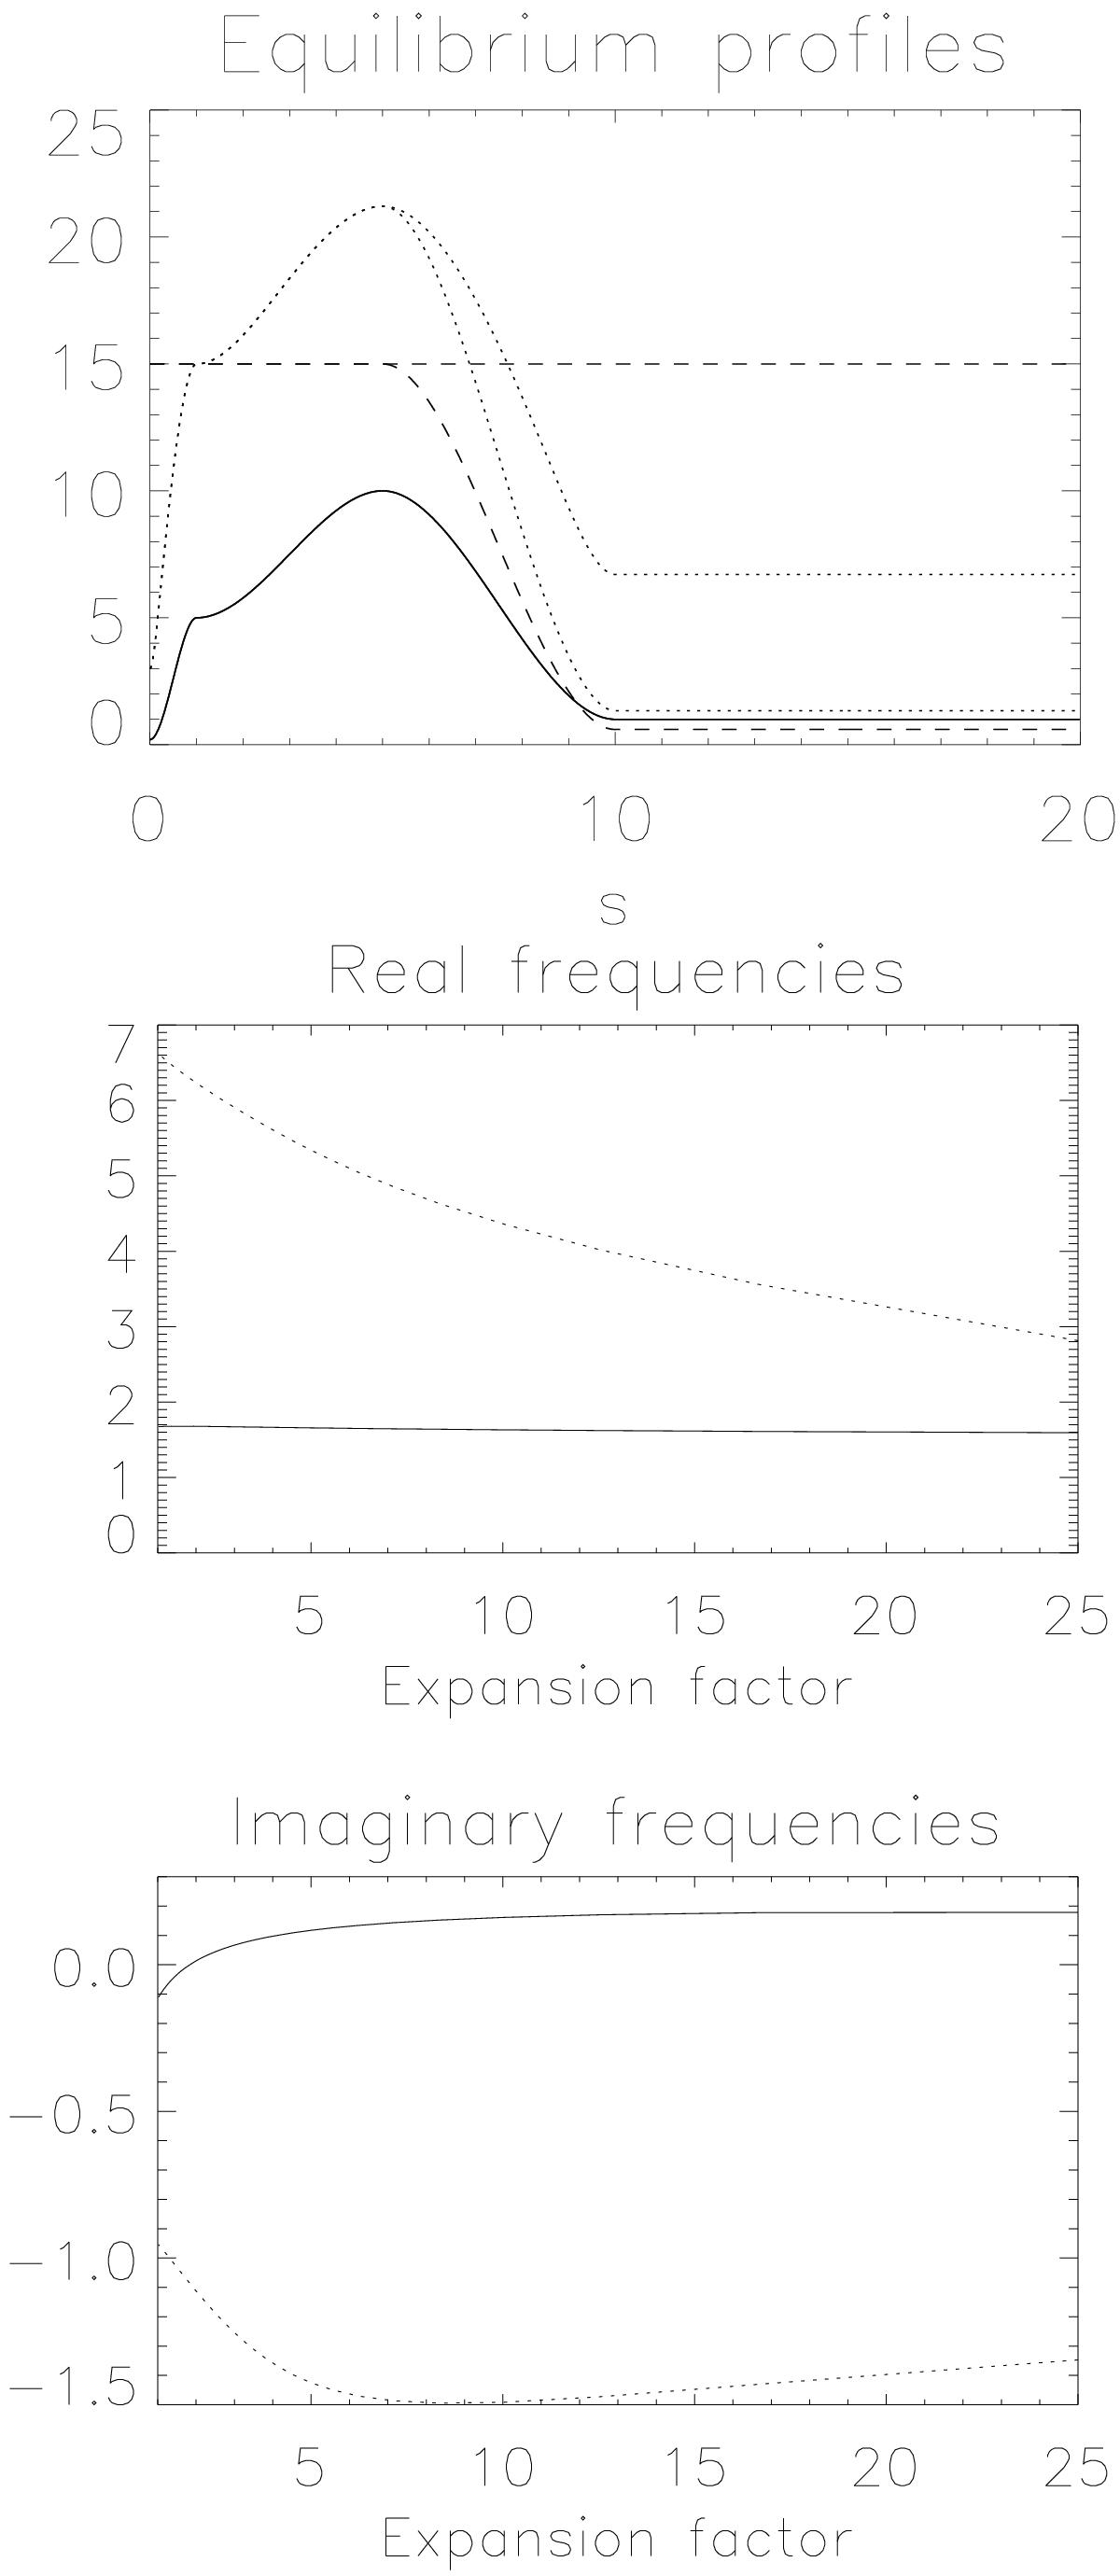
Different magnetic field profiles for a moderately expanding tube are plotted in the upper panel with dashed lines. The first profile is constant, the second one decreases by a factor of 25. The corresponding Alfvén speeds are plotted with dotted lines. The flow profile is fixed. The lower two panels display the eigenmode frequencies as functions of the expansion factor which is reciprocal to the magnetic field strength. An unstable mode appears as the tube begins to expand.
Current usage metrics show cumulative count of Article Views (full-text article views including HTML views, PDF and ePub downloads, according to the available data) and Abstracts Views on Vision4Press platform.
Data correspond to usage on the plateform after 2015. The current usage metrics is available 48-96 hours after online publication and is updated daily on week days.
Initial download of the metrics may take a while.