Fig. 2
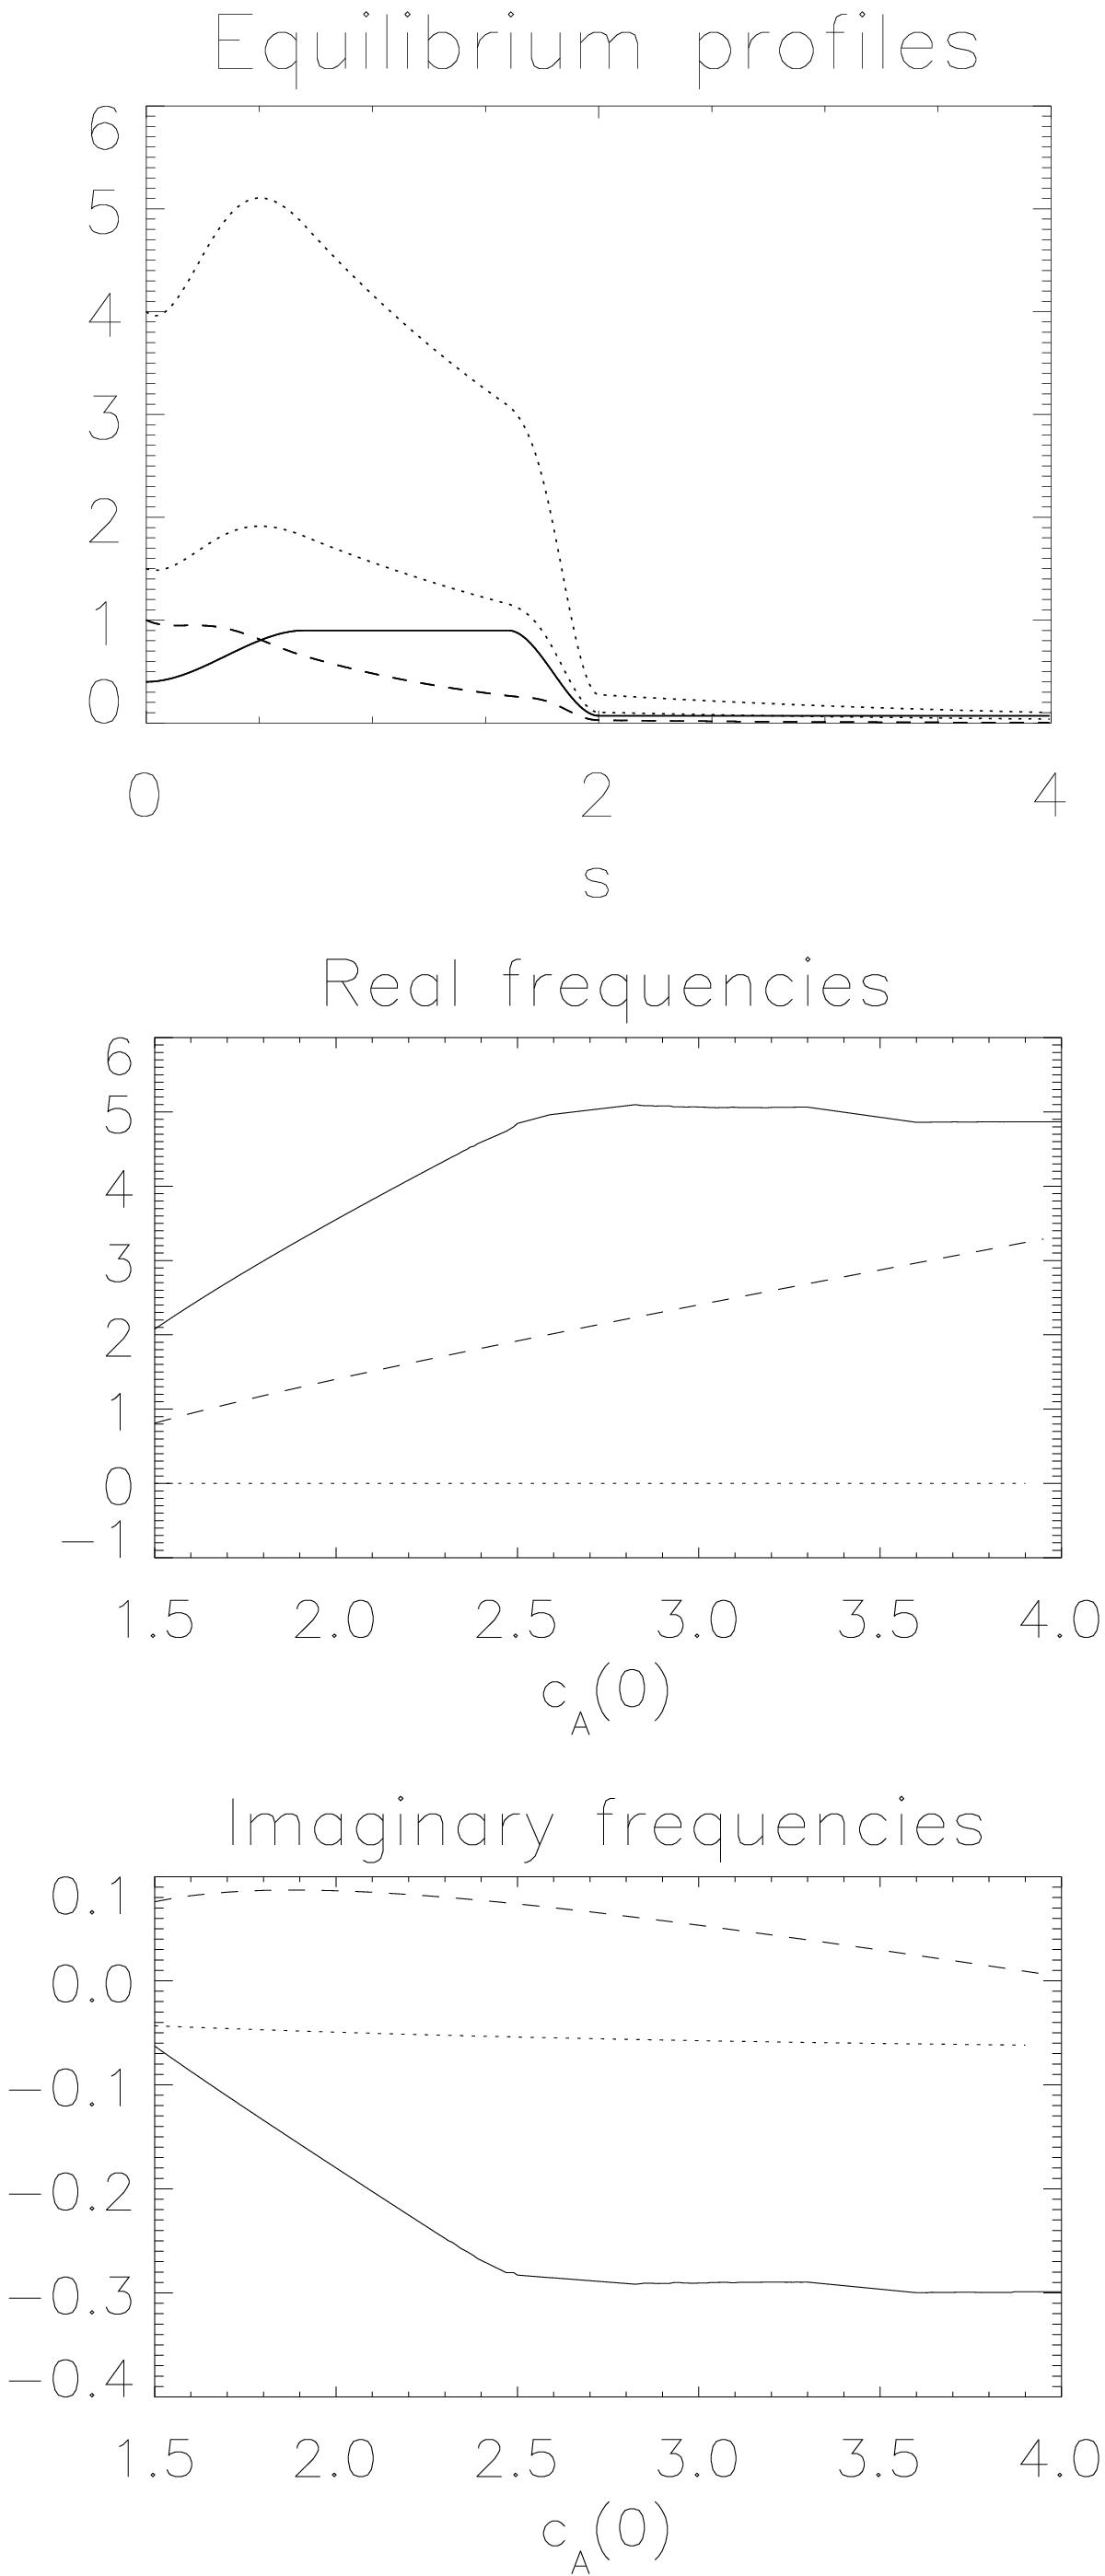
Profiles of a subsonic equilibrium flow (solid) and a decreasing magnetic field (dashed). The segment of the tube with decelerating flow corresponds to rapid expansion of the flux tube. Smooth profiles of the Alfvén speed with cA(0) = 1.5 and cA(0) = 4 are plotted with dotted lines. The lower two panels display the continuous variation of cA(0) from to 1.5 to 4 and the corresponding real and imaginary frequencies of the eigenmodes. The dashed lines represent an unstable mode. Strongly damped modes are not shown.
Current usage metrics show cumulative count of Article Views (full-text article views including HTML views, PDF and ePub downloads, according to the available data) and Abstracts Views on Vision4Press platform.
Data correspond to usage on the plateform after 2015. The current usage metrics is available 48-96 hours after online publication and is updated daily on week days.
Initial download of the metrics may take a while.