Fig. 5
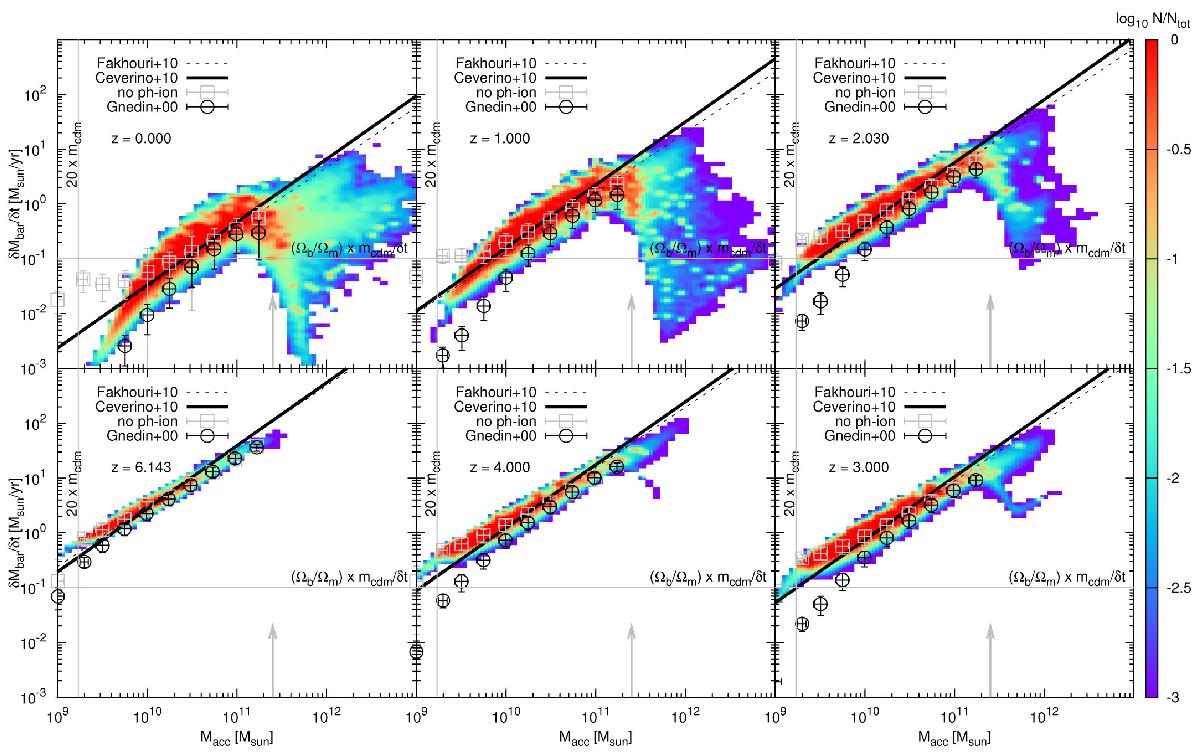
The total smooth baryonic accretion onto the galaxy. The colour shading shows the total baryonic accretion rate (free-fall coming from filaments and cooling flows) from our reference model, as a function of dark-matter halo mass, and for a set of redshifts. The colour scale indicates the normalised logarithmic density of objects. We add for information the transition mass (1011.4 M⊙, grey vertical arrow) used in the accretion mode repartition (Eq. (14)). The dotted and solid black lines show the average baryonic accretion rate deduced from hydrodynamic simulations by Fakhouri et al. (2010) and Ceverino et al. (2010), respectively. Black circles are for a model with photoionisation prescription by Gnedin (2000) instead of our Okamoto et al. (2008) standard prescription. Grey squares show the accretion for a model without any photoionisation process.
Current usage metrics show cumulative count of Article Views (full-text article views including HTML views, PDF and ePub downloads, according to the available data) and Abstracts Views on Vision4Press platform.
Data correspond to usage on the plateform after 2015. The current usage metrics is available 48-96 hours after online publication and is updated daily on week days.
Initial download of the metrics may take a while.