Fig. A.1
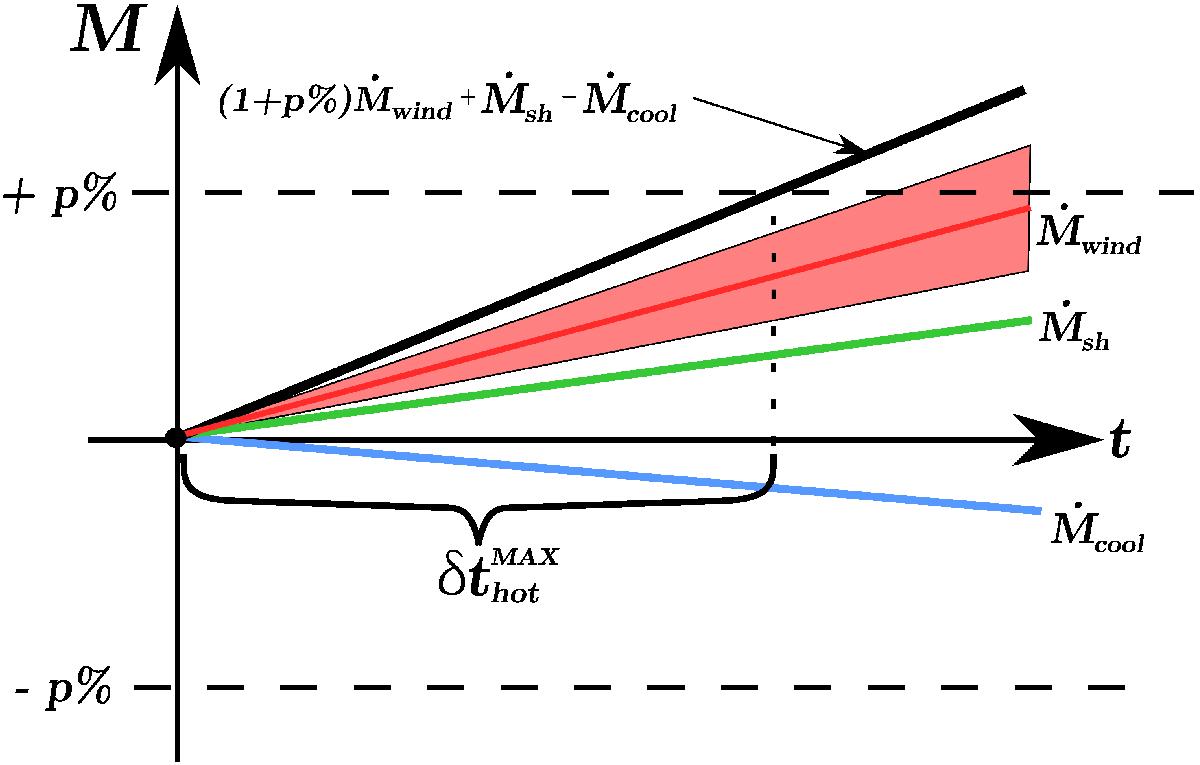
Diagram illustrating the computation of the optimal time step of the hot gas
phase (![]() ).
The two horizontal dash lines materialise the maximum variation, p%. In the case
shown here, the evolution of the hot gas phase is dominated by input flows:
Ṁsh +
Ṁwind>Ṁcool.
The optimum time step for the hot-gas phase evolution is therefore computed
assuming an increase in the galaxy ejecta rate (1 +
p%)Ṁwind.
).
The two horizontal dash lines materialise the maximum variation, p%. In the case
shown here, the evolution of the hot gas phase is dominated by input flows:
Ṁsh +
Ṁwind>Ṁcool.
The optimum time step for the hot-gas phase evolution is therefore computed
assuming an increase in the galaxy ejecta rate (1 +
p%)Ṁwind.
Current usage metrics show cumulative count of Article Views (full-text article views including HTML views, PDF and ePub downloads, according to the available data) and Abstracts Views on Vision4Press platform.
Data correspond to usage on the plateform after 2015. The current usage metrics is available 48-96 hours after online publication and is updated daily on week days.
Initial download of the metrics may take a while.