Fig. 10
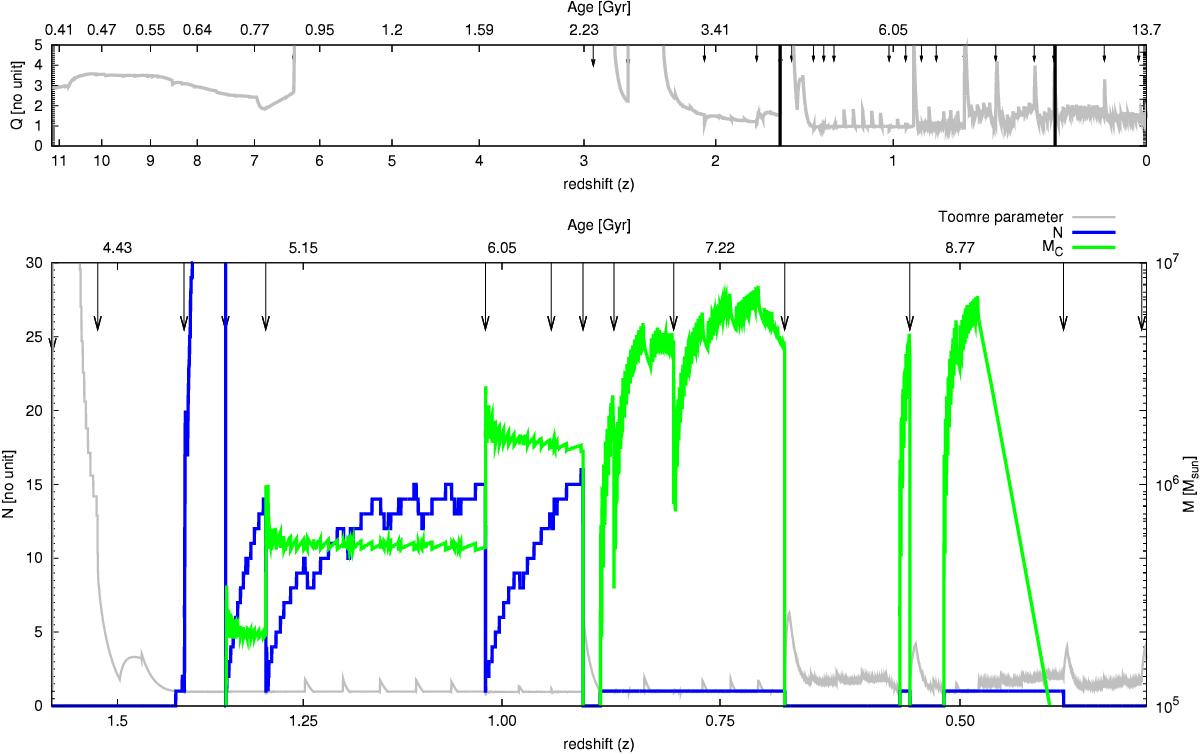
Evolution of the disc-stability criterion (Toomre parameter Q) and clump properties. In the upper panel is shown the evolution of the Toomre parameter with z (Eq. (68), grey line). On this timeline, vertical arrows indicate a merger event (with short and long arrows for minor and major mergers, respectively). For 11 <z< 1.5, the Toomre parameter is larger than the critical value Q>Qcrit = 1, and therefore the disc is stable, but for 1.5 <z< 0.25 (highlighted by the two vertical black lines), the disc becomes unstable. During the unstable transition, bounded by two merger events, many clumps are formed and migrate. The lower panel shows a zoom of this unstable period. The blue and green lines show the number of clumps (left y-axis) and the average individual mass of these clumps (right y-axis), respectively. After a merger event, disc instabilities lead to the formation of a large number of clumps (42) with small individual masses (![]() ). Then, during a series of merger events, clumps are destroyed and formed again, but with higher individual masses. Between two merger events, the number of clumps increases while the individual mass
). Then, during a series of merger events, clumps are destroyed and formed again, but with higher individual masses. Between two merger events, the number of clumps increases while the individual mass ![]() remains stable. A decrease in one or two clumps is linked to the migration process. It is interesting to note that the migration process creates a temporary stable disc (Q>Qcrit = 1). In the second part of the unstable period, only one clump is formed but with a much higher mass. Finally, this single clump is disrupted and the disc becomes stable again.
remains stable. A decrease in one or two clumps is linked to the migration process. It is interesting to note that the migration process creates a temporary stable disc (Q>Qcrit = 1). In the second part of the unstable period, only one clump is formed but with a much higher mass. Finally, this single clump is disrupted and the disc becomes stable again.
Current usage metrics show cumulative count of Article Views (full-text article views including HTML views, PDF and ePub downloads, according to the available data) and Abstracts Views on Vision4Press platform.
Data correspond to usage on the plateform after 2015. The current usage metrics is available 48-96 hours after online publication and is updated daily on week days.
Initial download of the metrics may take a while.