Fig. 6
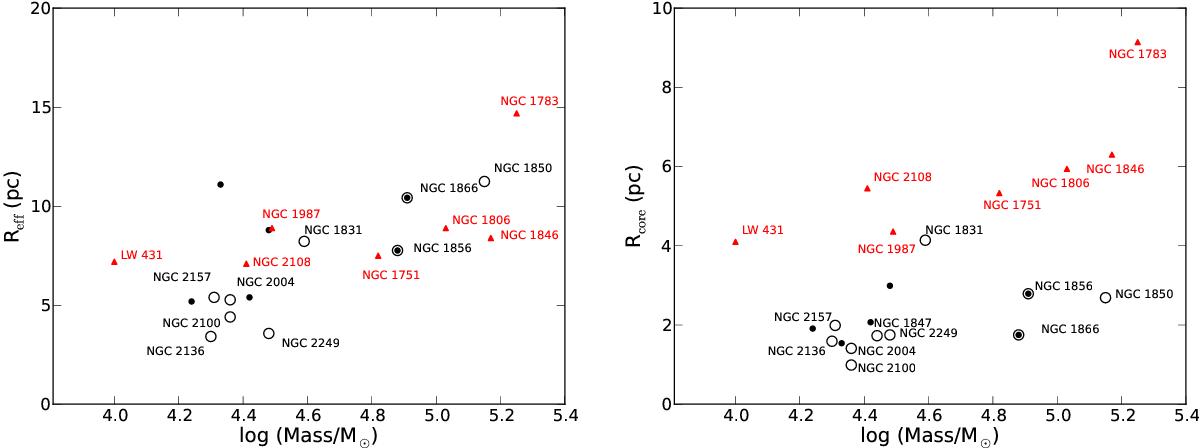
Left panel: plot of the mass versus the effective radius for our sample of YMCs (black circles) and some additional clusters with similar properties (black dots), taken from the catalog of McLaughlin & van der Marel (2005). The two clusters that are marked with a black dot surrounded by a black circle are the two clusters analyzed by Bastian & Silva-Villa (2013). The (red) triangles are clusters of intermediate ages that display extended MSTOs, from Goudfrooij et al. (2009, 2011a). In this plot NGC 1847 is not shown as its effective radius has a large uncertainty due to its shallow profile. We increased the mass of NGC 1850 by a factor of 2 with respect to the literature value to account for the new age that we found (see Sect. 4.5). Right panel: same as the left panel but for the core radius. It is shown, e.g. in Keller et al. (2011), that the core radii of clusters have larger spreads the older the clusters are. We note here that the core radii of all clusters from the Goudfrooij et al. (2009, 2011a) sample are systematically higher than the ones from our sample. One reason for this could be that the core radii given in Goudfrooij et al. (2009, 2011a) are obtained from the surface number density, whereas McLaughlin & van der Marel (2005) used the surface brightness profiles. Both methods do not yield the same value (see text).
Current usage metrics show cumulative count of Article Views (full-text article views including HTML views, PDF and ePub downloads, according to the available data) and Abstracts Views on Vision4Press platform.
Data correspond to usage on the plateform after 2015. The current usage metrics is available 48-96 hours after online publication and is updated daily on week days.
Initial download of the metrics may take a while.