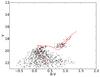
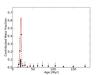
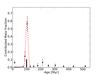
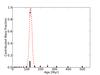
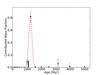
Fig. 5
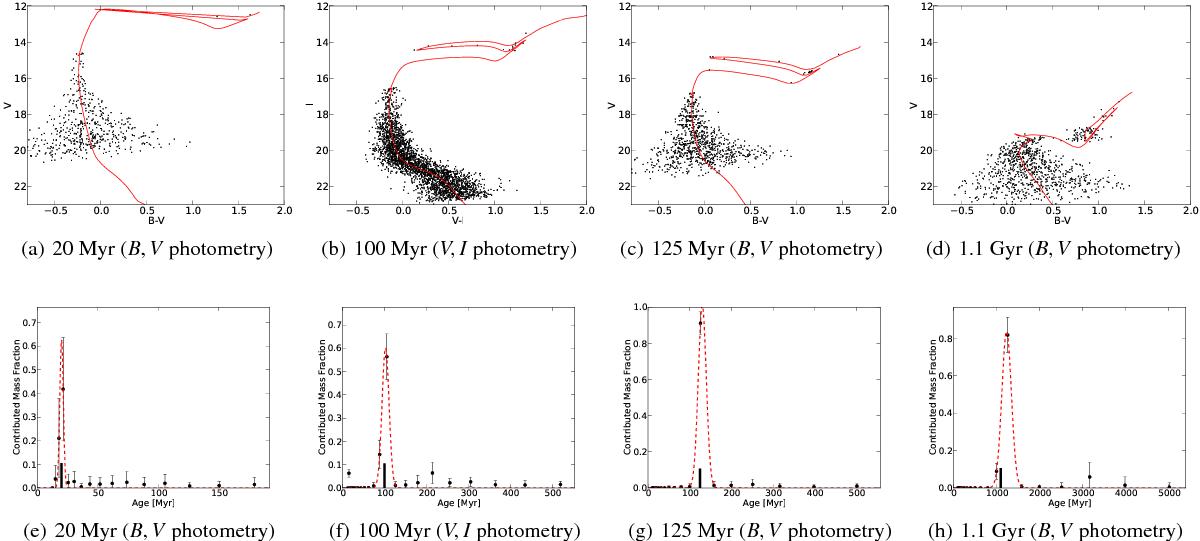
Upper panels: CMDs of four of the artificial clusters that we created. We simulated these clusters to estimate the resulting age spread of a single-age population given by our SFH fitting code caused only by photometric errors. All stars in one cluster have the same age and the photometric errors are estimated from the ones of the real clusters at the respective age. The clusters shown here have ages of 20, 100 Myr, 125 Myr and 1.1 Gyr, spanning the range of ages of the real clusters in our sample. The (red) line is the theoretical Parsec 1.1 Padova isochrone at the respective age of the cluster. Lower panels: results of the SFH fits of the four artificial star clusters shown in the upper panel. The dots represent the mean contributed mass fraction at individual ages of the 100 realizations whereas the errorbars are the standard deviation. The dashed (red) line is the best-fit Gaussian to the highest peak of the points taking into account the errorbars. Indicated as a vertical think line at the x-axis is the actual age of the respective cluster. The fit to the 20 Myr old cluster gives a peak at 20.1 Myr with a dispersion of 1.5 Myr. We got an age of 102 Myr for the 100 Myr old cluster with an standard deviation of 8.4 Myr and an age of 130 Myr with a dispersion of 9.6 Myr for the 125 Myr old cluster. The 1.1 Gyr old cluster has a fitted age of 1.2 Gyr. The standard deviation is 111 Myr.
Current usage metrics show cumulative count of Article Views (full-text article views including HTML views, PDF and ePub downloads, according to the available data) and Abstracts Views on Vision4Press platform.
Data correspond to usage on the plateform after 2015. The current usage metrics is available 48-96 hours after online publication and is updated daily on week days.
Initial download of the metrics may take a while.