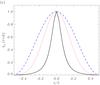
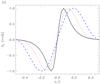
Fig. 6
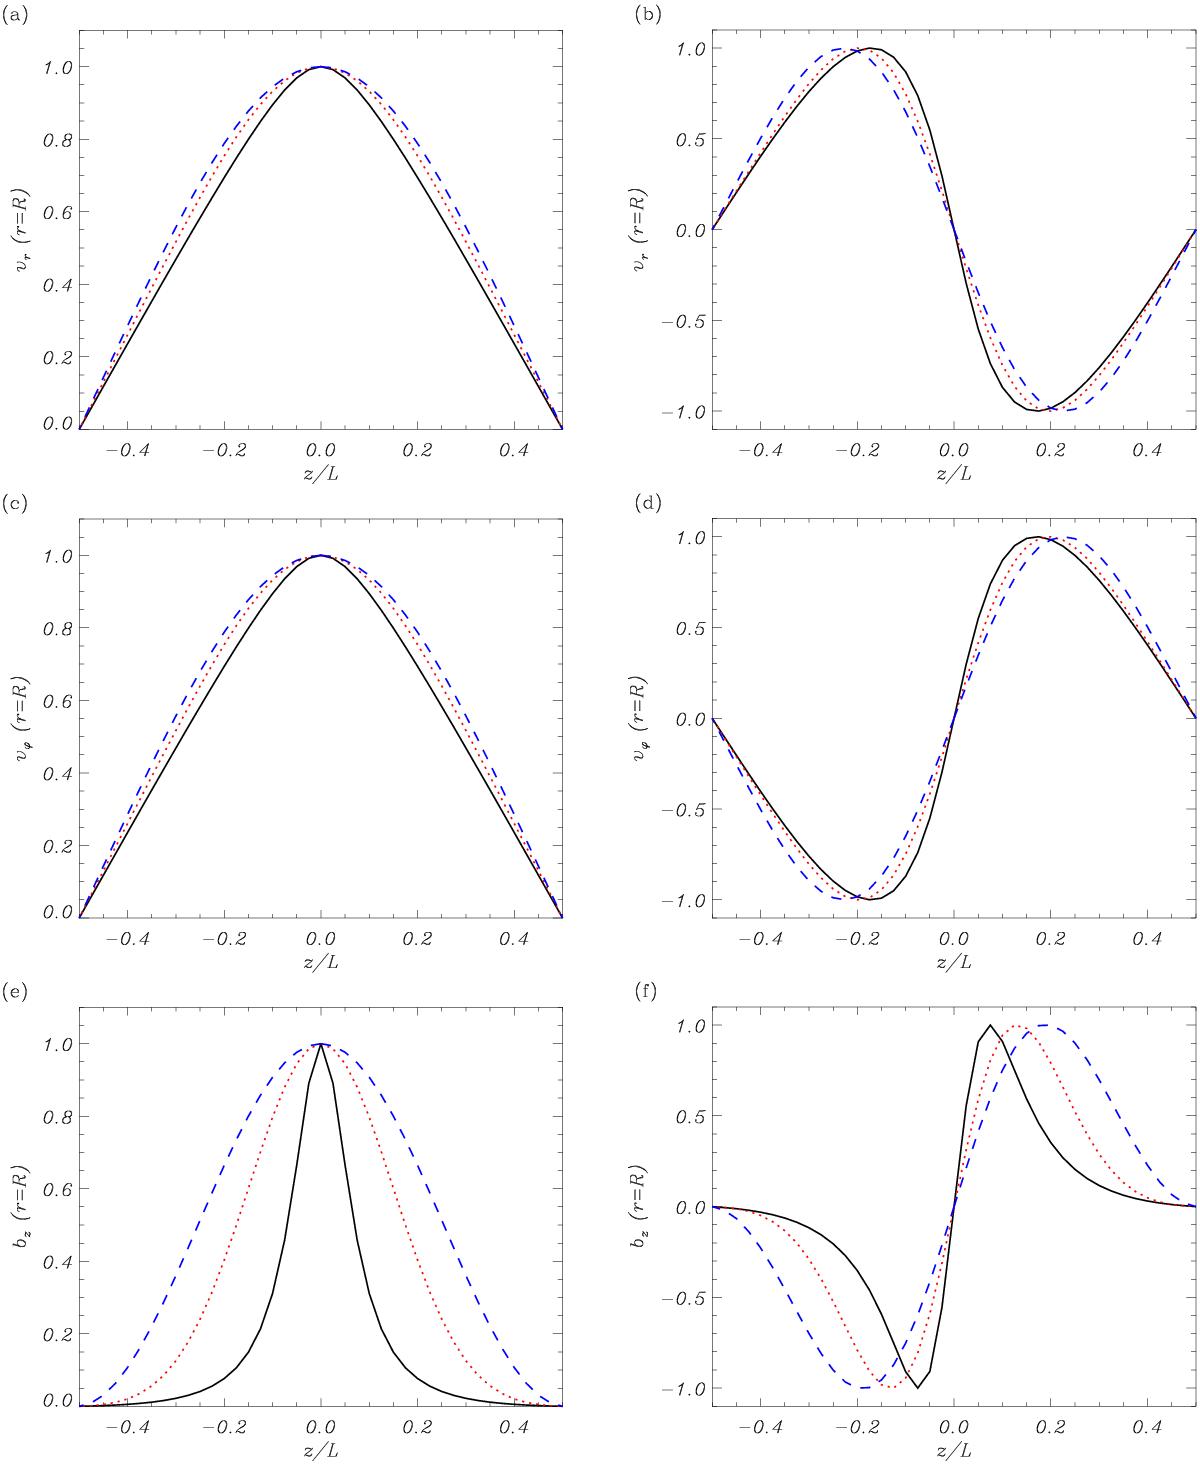
Longitudinal cuts at r = R of vr (top panels), vϕ (mid panels), and bz (bottom panels) corresponding to the fundamental mode (left panels) and the first overtone (right panels). The various lines are for the Lorentzian profile (black solid line), the Gaussian profile (red dotted line), and the parabolic profile (blue dashed line). We used L/R = 100, χ = 50, and ζ = 100 in all cases. Arbitrary units are used.

Current usage metrics show cumulative count of Article Views (full-text article views including HTML views, PDF and ePub downloads, according to the available data) and Abstracts Views on Vision4Press platform.
Data correspond to usage on the plateform after 2015. The current usage metrics is available 48-96 hours after online publication and is updated daily on week days.
Initial download of the metrics may take a while.