Fig. 6
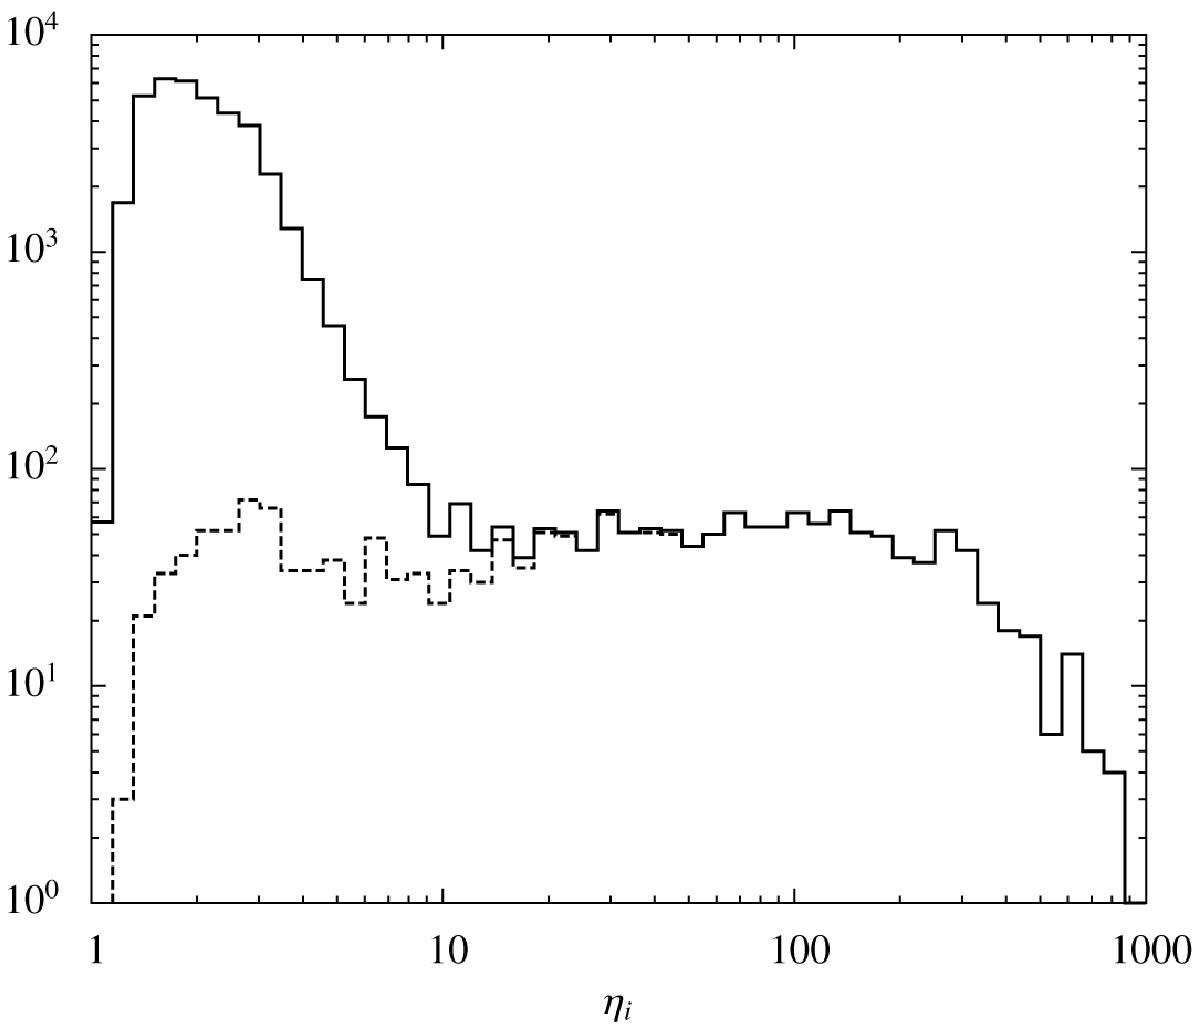
Histogram of the error variance correction factors ![]() for the data points of the SIP category in the simulation discussed in Sect. 3.3. The solid line shows the histogram for all data points in this category, while the dashed line shows the histogram only for the data points for which the noise variance was indeed increased in the simulation. Both axes are plotted logarithmically.
for the data points of the SIP category in the simulation discussed in Sect. 3.3. The solid line shows the histogram for all data points in this category, while the dashed line shows the histogram only for the data points for which the noise variance was indeed increased in the simulation. Both axes are plotted logarithmically.
Current usage metrics show cumulative count of Article Views (full-text article views including HTML views, PDF and ePub downloads, according to the available data) and Abstracts Views on Vision4Press platform.
Data correspond to usage on the plateform after 2015. The current usage metrics is available 48-96 hours after online publication and is updated daily on week days.
Initial download of the metrics may take a while.