Free Access
Fig. 5
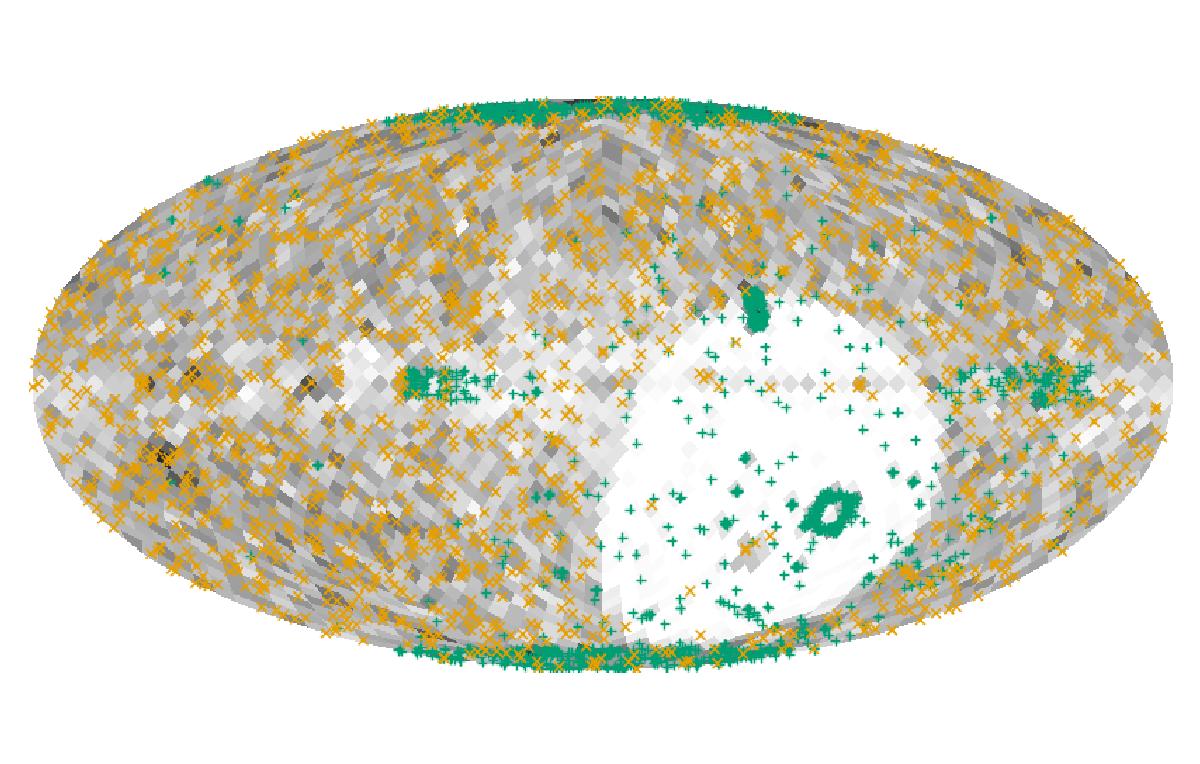
Locations of the simulated data points on the sky. The orange ×−signs denote data points of the SIP category for which the noise variance has been increased. Data points of the VIP category are shown as green +−signs and the grayscale shows the overall density of data points.
Current usage metrics show cumulative count of Article Views (full-text article views including HTML views, PDF and ePub downloads, according to the available data) and Abstracts Views on Vision4Press platform.
Data correspond to usage on the plateform after 2015. The current usage metrics is available 48-96 hours after online publication and is updated daily on week days.
Initial download of the metrics may take a while.