Fig. 2
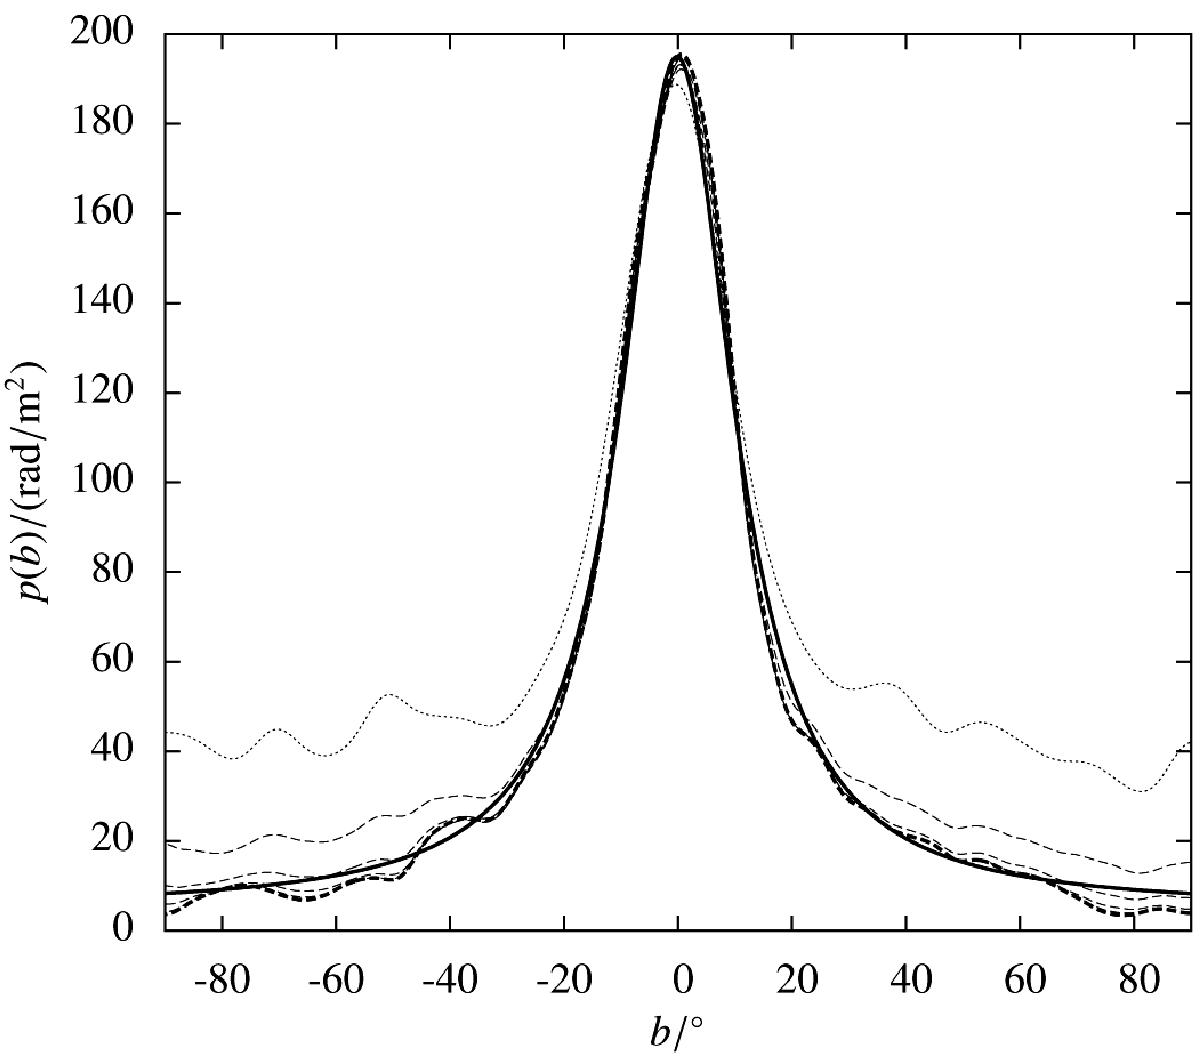
Galactic latitude profile used in the simulation and its reconstruction. The thick solid line is the simulated profile, the thin dotted line is the profile initially used in the reconstruction and calculated directly from the simulated data. Subsequent reconstructions of the profile function are shown as thin dashed lines with earlier iterations lying higher in the plot. The final reconstruction is depicted by the thick dashed line.
Current usage metrics show cumulative count of Article Views (full-text article views including HTML views, PDF and ePub downloads, according to the available data) and Abstracts Views on Vision4Press platform.
Data correspond to usage on the plateform after 2015. The current usage metrics is available 48-96 hours after online publication and is updated daily on week days.
Initial download of the metrics may take a while.