Fig. 14
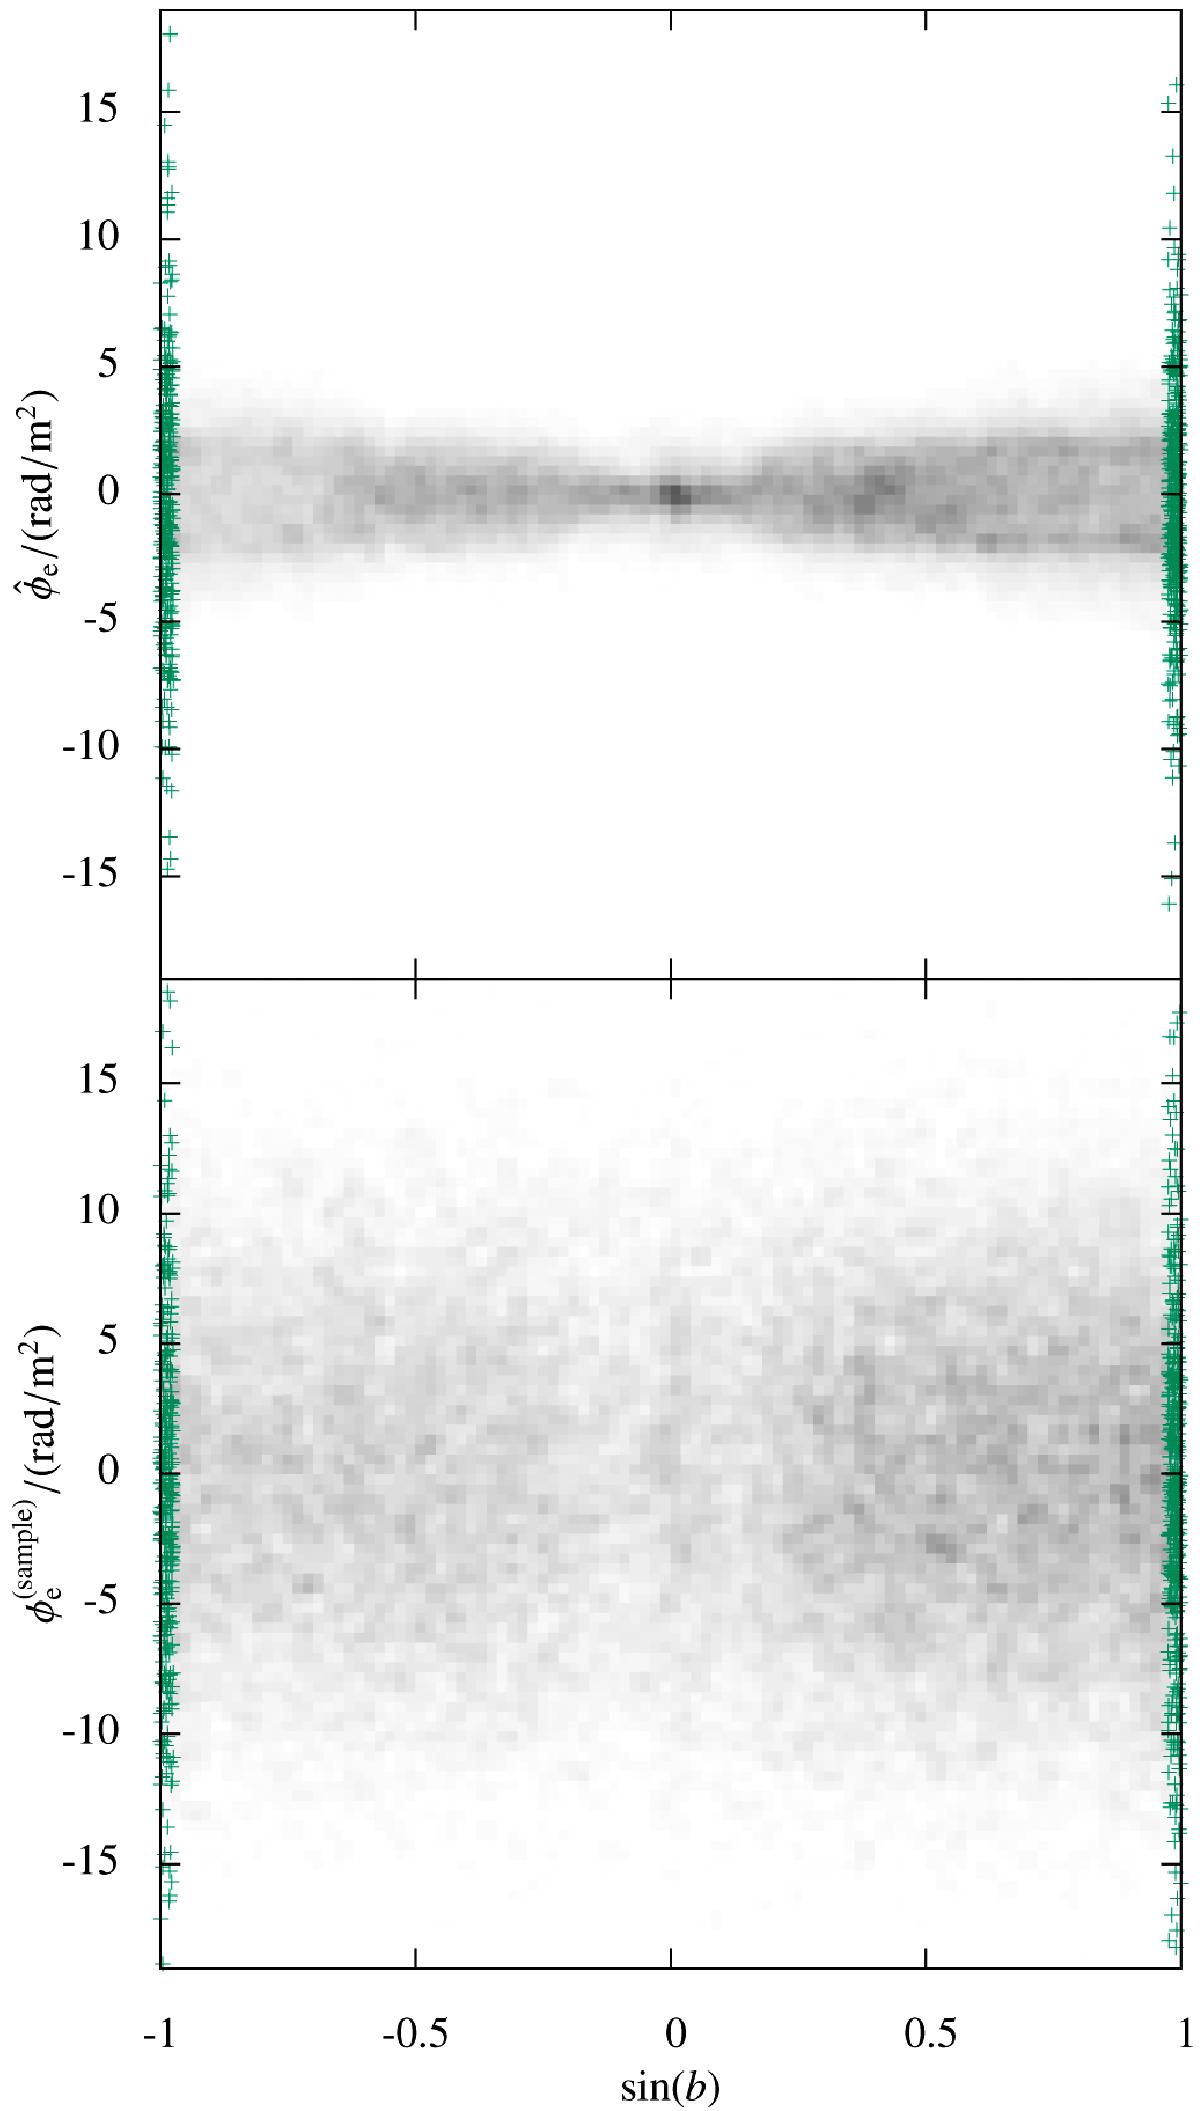
Top: estimates for the extragalactic contribution to each source’s observed Faraday depth for the “polar caps” analysis versus Galactic latitude. Bottom: the same for a random sample drawn from the posterior PDF for the extragalactic contributions around the mean plotted in the upper panel. In both panels, the grayscale shows the density of the data points of the SIP category, i.e., with noise variance correction factors, and data points of the VIP category, i.e., without noise variance correction factors, are plotted as green +–symbols.
Current usage metrics show cumulative count of Article Views (full-text article views including HTML views, PDF and ePub downloads, according to the available data) and Abstracts Views on Vision4Press platform.
Data correspond to usage on the plateform after 2015. The current usage metrics is available 48-96 hours after online publication and is updated daily on week days.
Initial download of the metrics may take a while.