Free Access
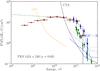
Fig. 8
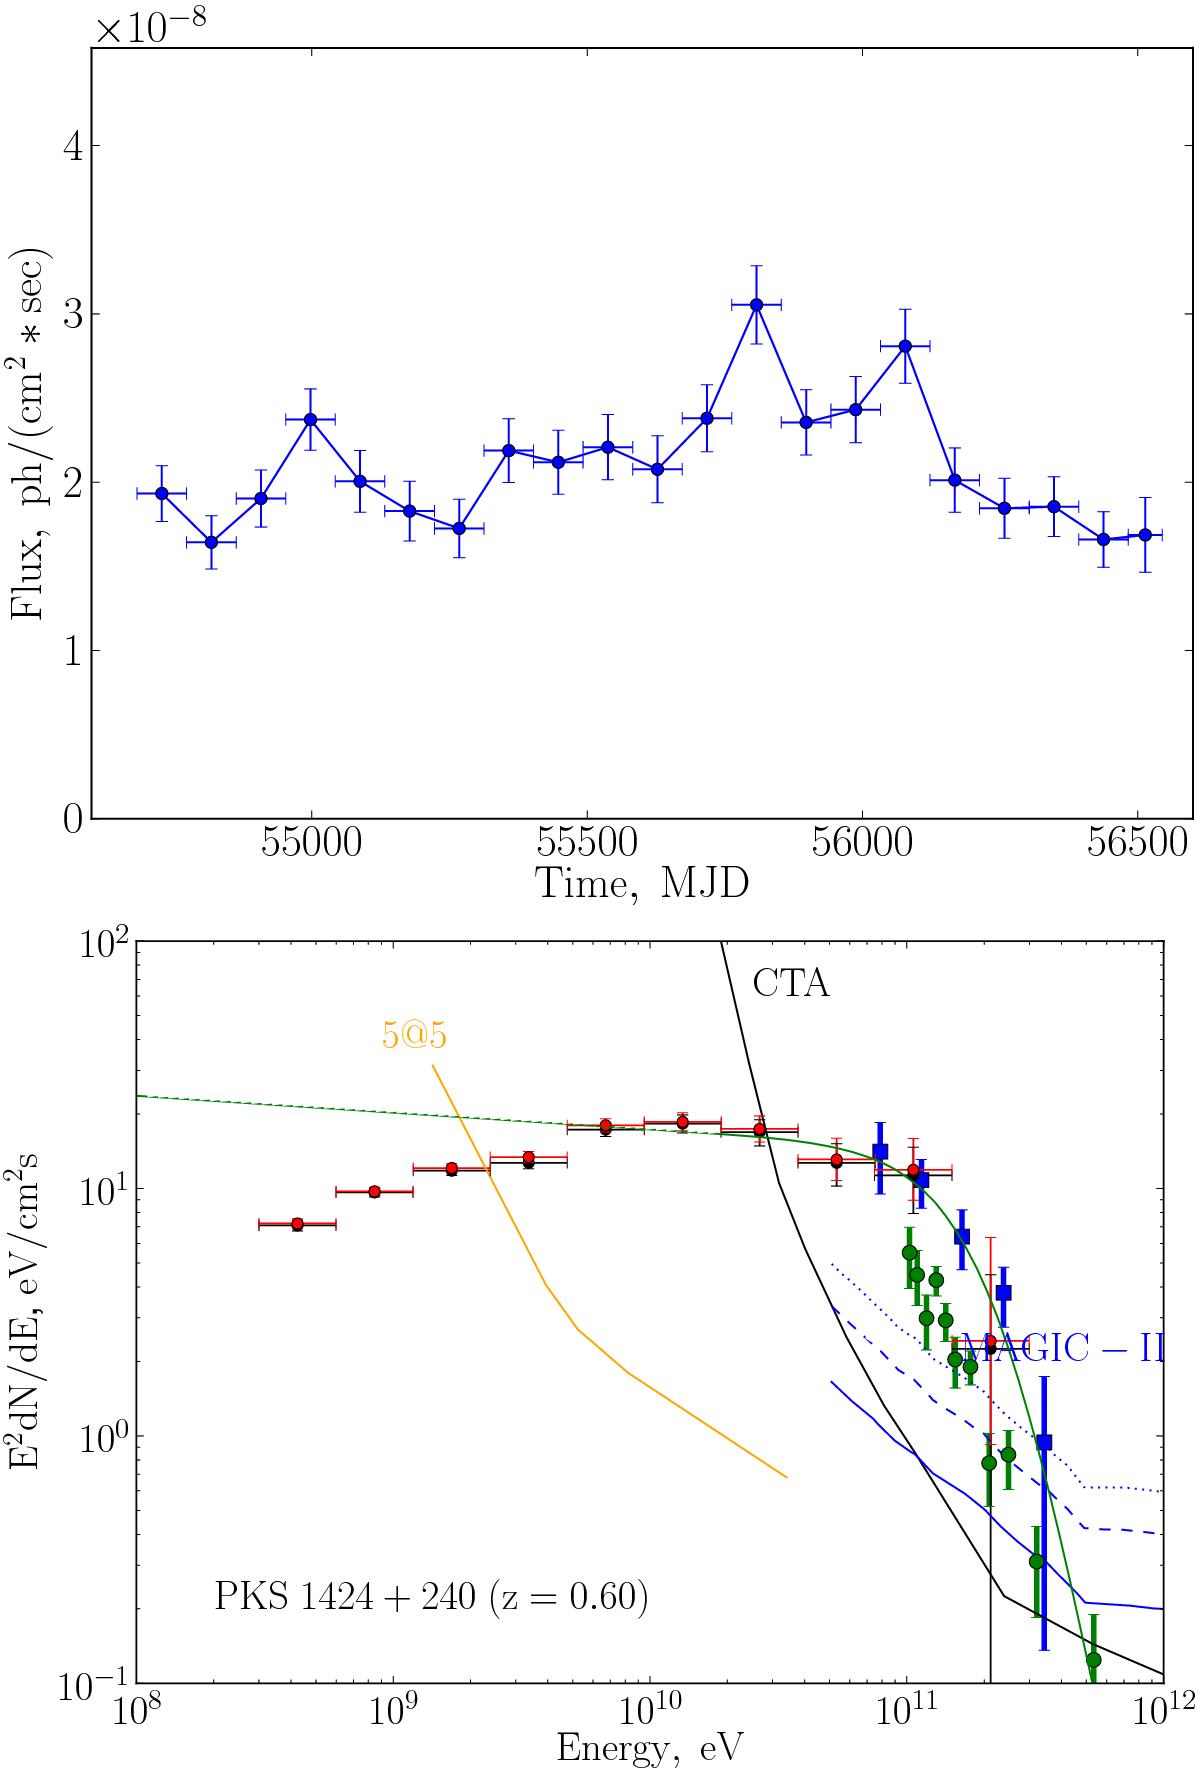
Light curve (top) and spectrum (bottom) of PKS 1424+240 at the redshift z = 0.60. Blue squares show the VHE spectrum of the source as measured by MAGIC in 2011 (Aleksić et al. 2014) and green circles show it as seen by VERITAS in 2013 (Archambault et al. 2014). Other notations are the same as in Fig. 3.
This figure is made of several images, please see below:
Current usage metrics show cumulative count of Article Views (full-text article views including HTML views, PDF and ePub downloads, according to the available data) and Abstracts Views on Vision4Press platform.
Data correspond to usage on the plateform after 2015. The current usage metrics is available 48-96 hours after online publication and is updated daily on week days.
Initial download of the metrics may take a while.