Fig. 1
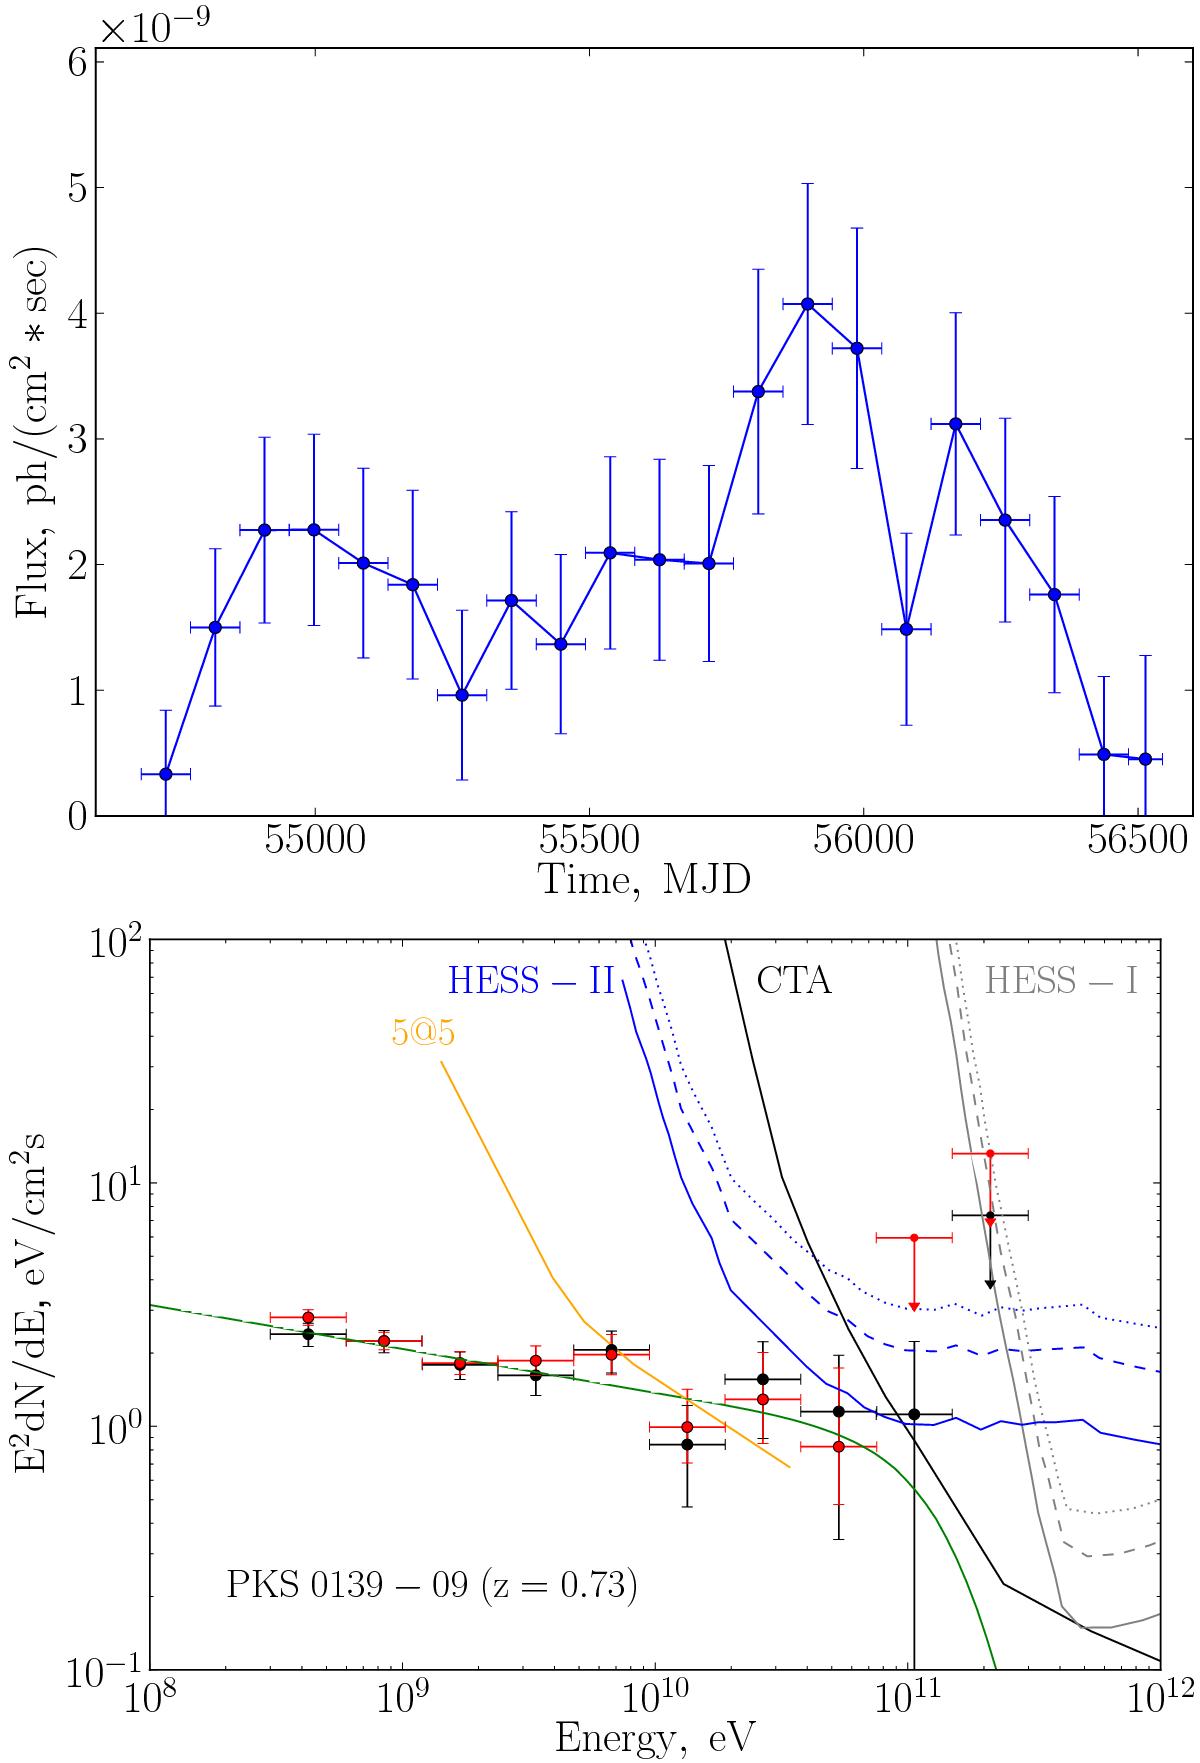
Light curve (top) and spectrum (bottom) of PKS 0139-09 at redshift z = 0.733. Green curve in the bottom panel shows a power-law-type model spectrum absorbed on the EBL from Franceschini et al. (2008). Also shown in the bottom panel are sensitivity curves of different ground based γ-ray telescopes: 5@5 (Aharonian et al. 2000), HESS-I and HESS-II (Masbou 2010), and CTA (CTA Consortium 2011). The solid sensitivity curves for HESS-I and HESS-II correspond to spectral index of Γ = 2, dashed – to Γ = 3, and dotted – to Γ = 4. Black and red data points in the lower panel show the spectrum extracted using the likelihood analysis and aperture photometry method, respectively.
Current usage metrics show cumulative count of Article Views (full-text article views including HTML views, PDF and ePub downloads, according to the available data) and Abstracts Views on Vision4Press platform.
Data correspond to usage on the plateform after 2015. The current usage metrics is available 48-96 hours after online publication and is updated daily on week days.
Initial download of the metrics may take a while.