Fig. 2
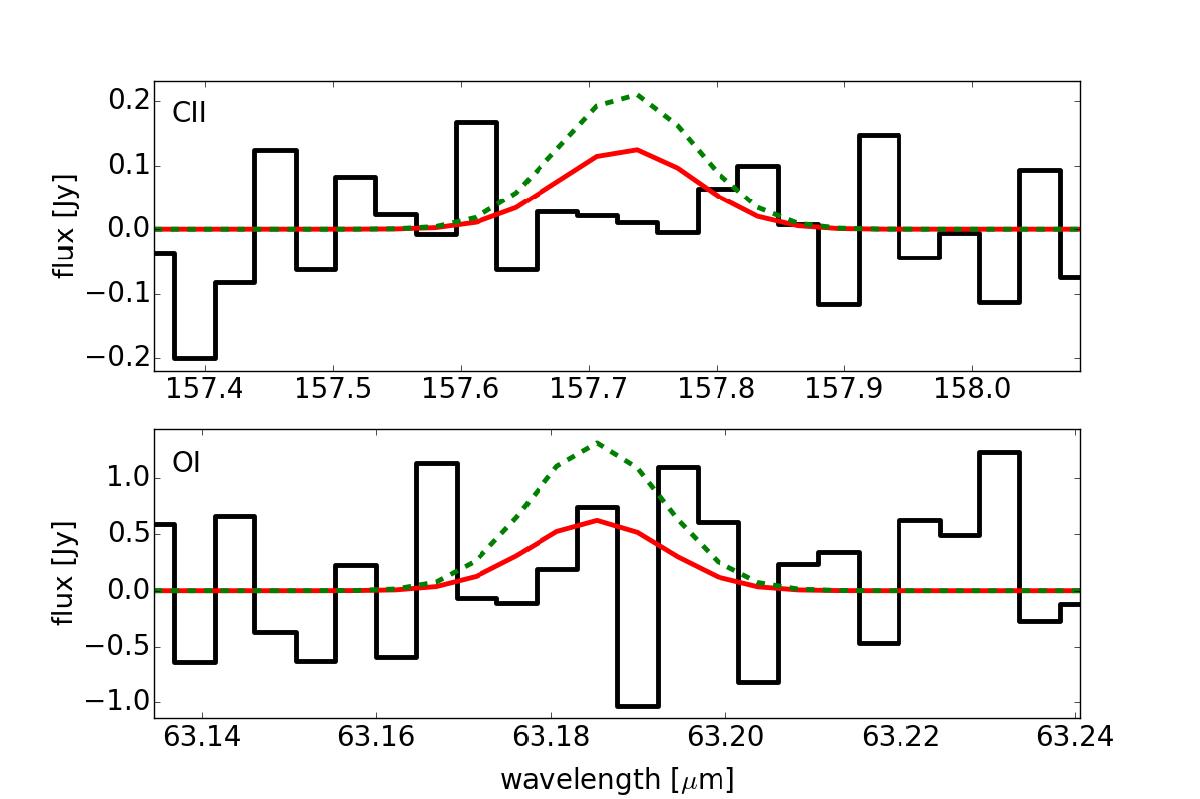
Line fluxes (C ii and O i) obtained when co-adding spaxels marked with bold edges in Fig. 1. A 99% confidence level upper limit was derived by integrating over a 2*FWHM wide wavelength range centred at the line wavelength and propagating the error on the integrated flux. The dashed line shows the Gaussian profile containing this upper limit flux. The plain line shows the profile obtained by co-adding the same spaxels containing our simulated spectra corresponding to the Bayesian upper limit, demonstrating the stronger limit obtained with our detailed model.
Current usage metrics show cumulative count of Article Views (full-text article views including HTML views, PDF and ePub downloads, according to the available data) and Abstracts Views on Vision4Press platform.
Data correspond to usage on the plateform after 2015. The current usage metrics is available 48-96 hours after online publication and is updated daily on week days.
Initial download of the metrics may take a while.