Fig. 1
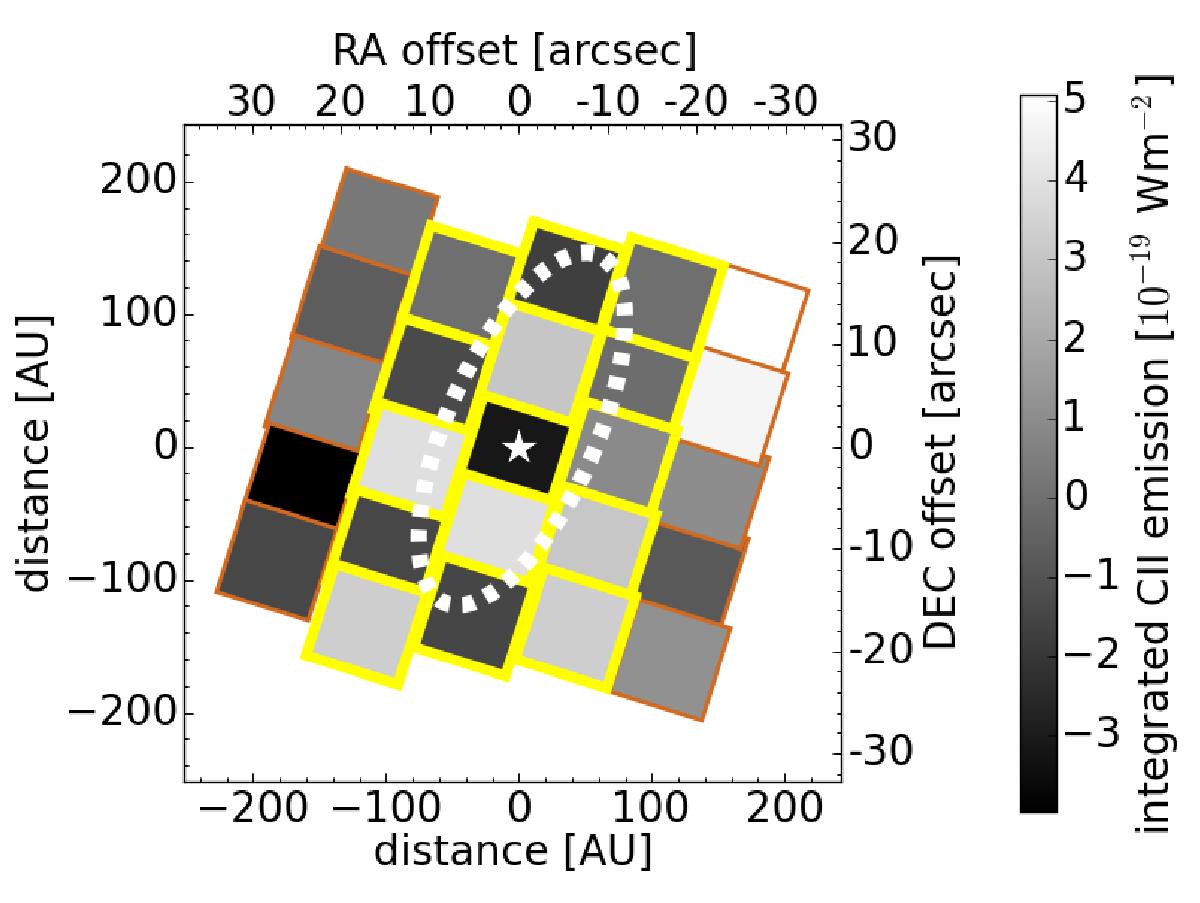
Placement of the 25 PACS spaxels relative to Fomalhaut (marked by the white star) in the case of the C ii observations. The grey scale indicates the integrated C ii emission for each spaxel within a window of width equal to 2.5*FWHM of the line. The ellipse shows the location of the peak density of mm grains according to the best-fit model by B12. The corresponding figure for the O i data looks very similar. The 15 spaxels with a yellow bold edge were summed to produce Fig. 2.
Current usage metrics show cumulative count of Article Views (full-text article views including HTML views, PDF and ePub downloads, according to the available data) and Abstracts Views on Vision4Press platform.
Data correspond to usage on the plateform after 2015. The current usage metrics is available 48-96 hours after online publication and is updated daily on week days.
Initial download of the metrics may take a while.