Free Access
Fig. 8
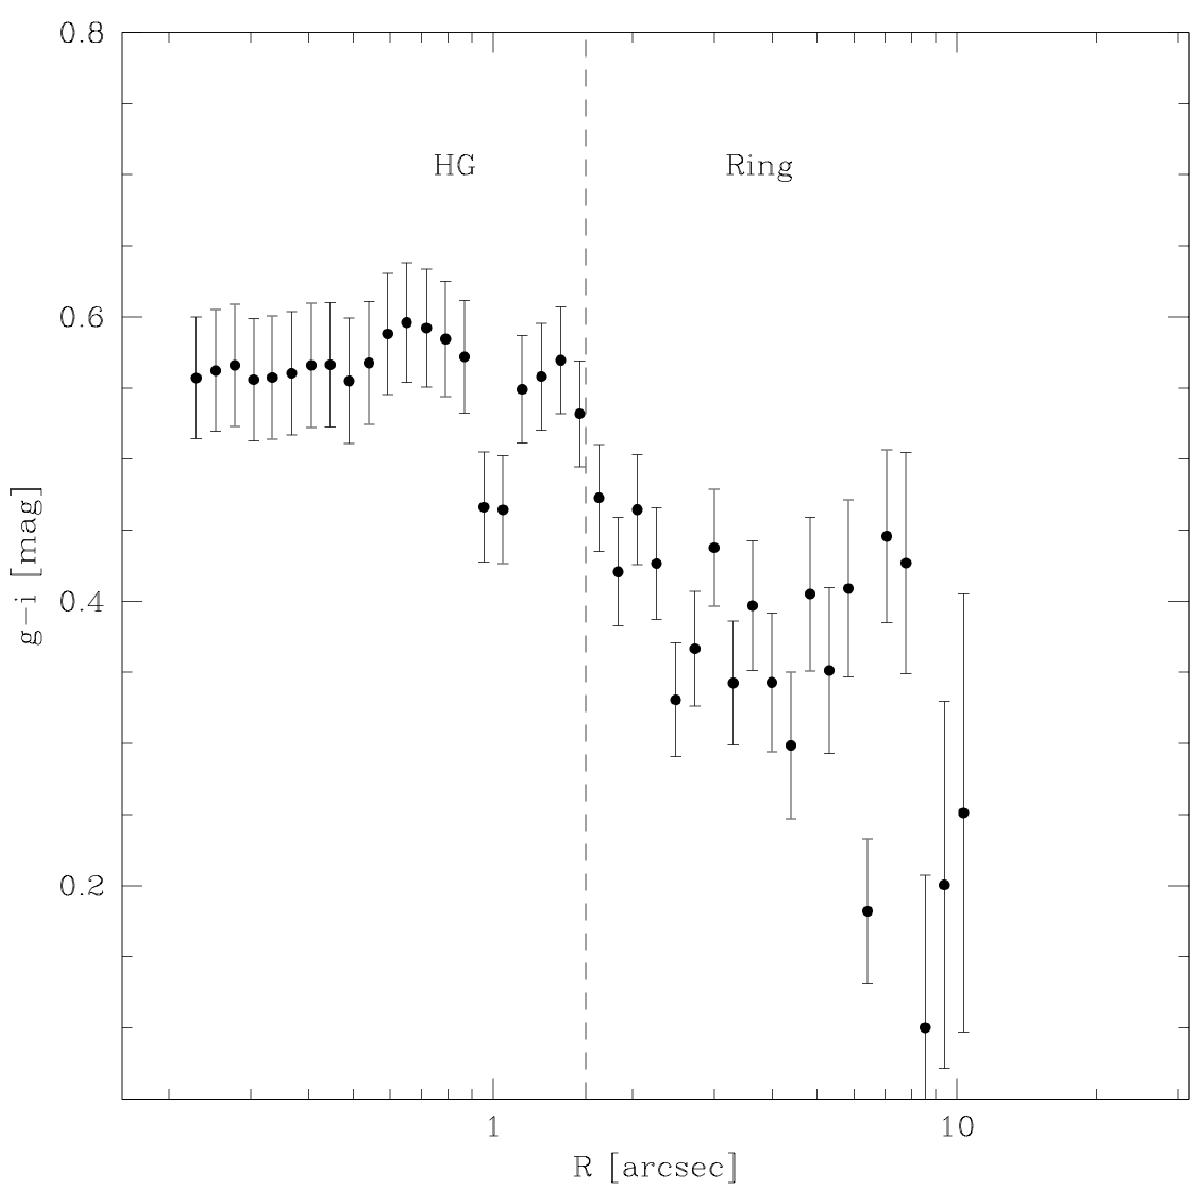
Azimuthally averaged g − i color profile as function of log(R) derived from the isophote fit. R is the isophote major axis. The dashed line delimits the regions where the main components (HG and polar ring) of the galaxy structure are located.
Current usage metrics show cumulative count of Article Views (full-text article views including HTML views, PDF and ePub downloads, according to the available data) and Abstracts Views on Vision4Press platform.
Data correspond to usage on the plateform after 2015. The current usage metrics is available 48-96 hours after online publication and is updated daily on week days.
Initial download of the metrics may take a while.