Fig. 7
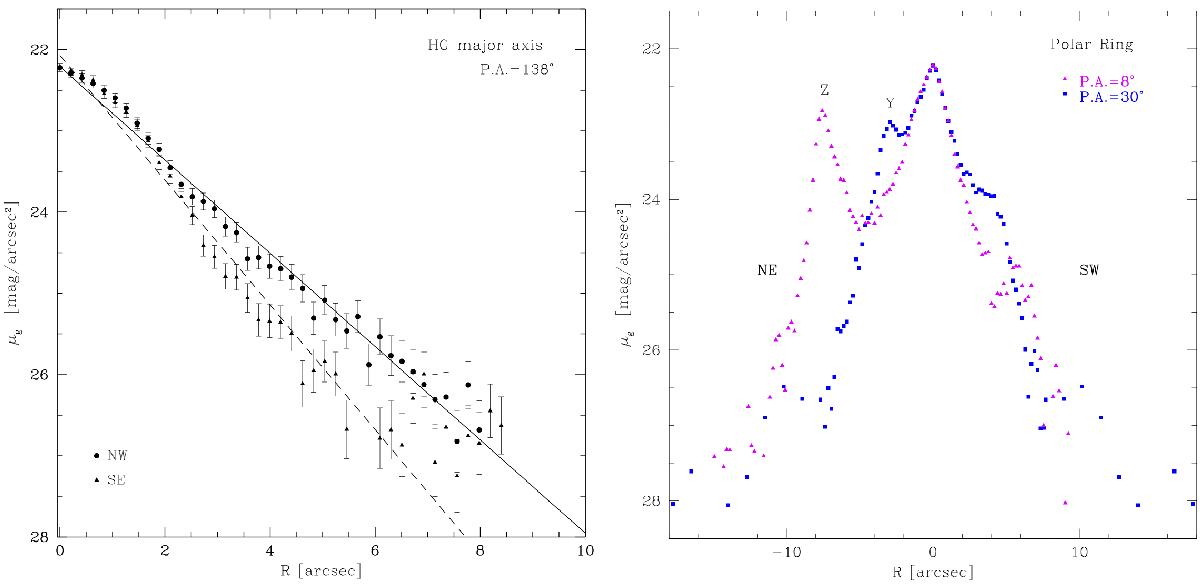
Left panel: folded light profiles in the g band along the major axis of the central spheroid. The continuos and dashed lines are the results of the exponential fits to the light distribution for the NW (circles) and SE (triangles) sides (see Sect. 3 for details). Right panel: light profiles in the g band along the polar structure. The two directions at PA = 8° and PA = 30° are chosen to intersect the two bright knots Y and Z, observed in the northern arm (see also Fig. 2 left panel).
Current usage metrics show cumulative count of Article Views (full-text article views including HTML views, PDF and ePub downloads, according to the available data) and Abstracts Views on Vision4Press platform.
Data correspond to usage on the plateform after 2015. The current usage metrics is available 48-96 hours after online publication and is updated daily on week days.
Initial download of the metrics may take a while.