Fig. 5
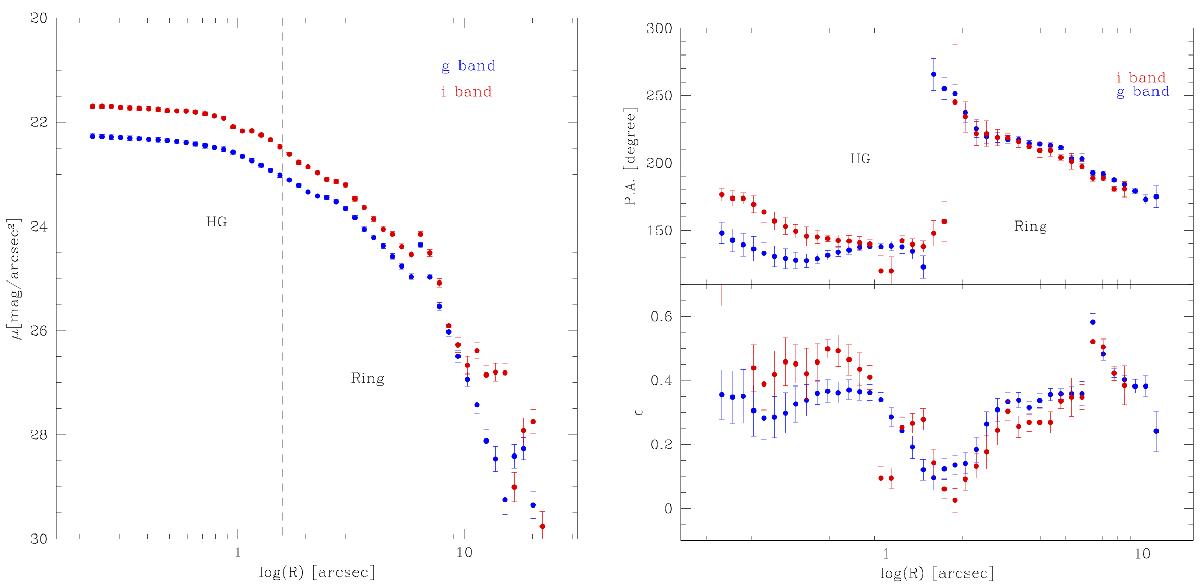
Left panel: azimuthally averaged surface brightness profiles as a function of log(R) derived from the isophote fit. R is the isophote major axis. Data are for the g-band (blue dots) and i-band image (red dots). The dashed line delimits the regions where the main components (HG and polar ring) of the galaxy structure are located. Right panel: average profiles of PA (top panel) and ellipticity (bottom panel) as a function of log(R).
Current usage metrics show cumulative count of Article Views (full-text article views including HTML views, PDF and ePub downloads, according to the available data) and Abstracts Views on Vision4Press platform.
Data correspond to usage on the plateform after 2015. The current usage metrics is available 48-96 hours after online publication and is updated daily on week days.
Initial download of the metrics may take a while.