Fig. 9
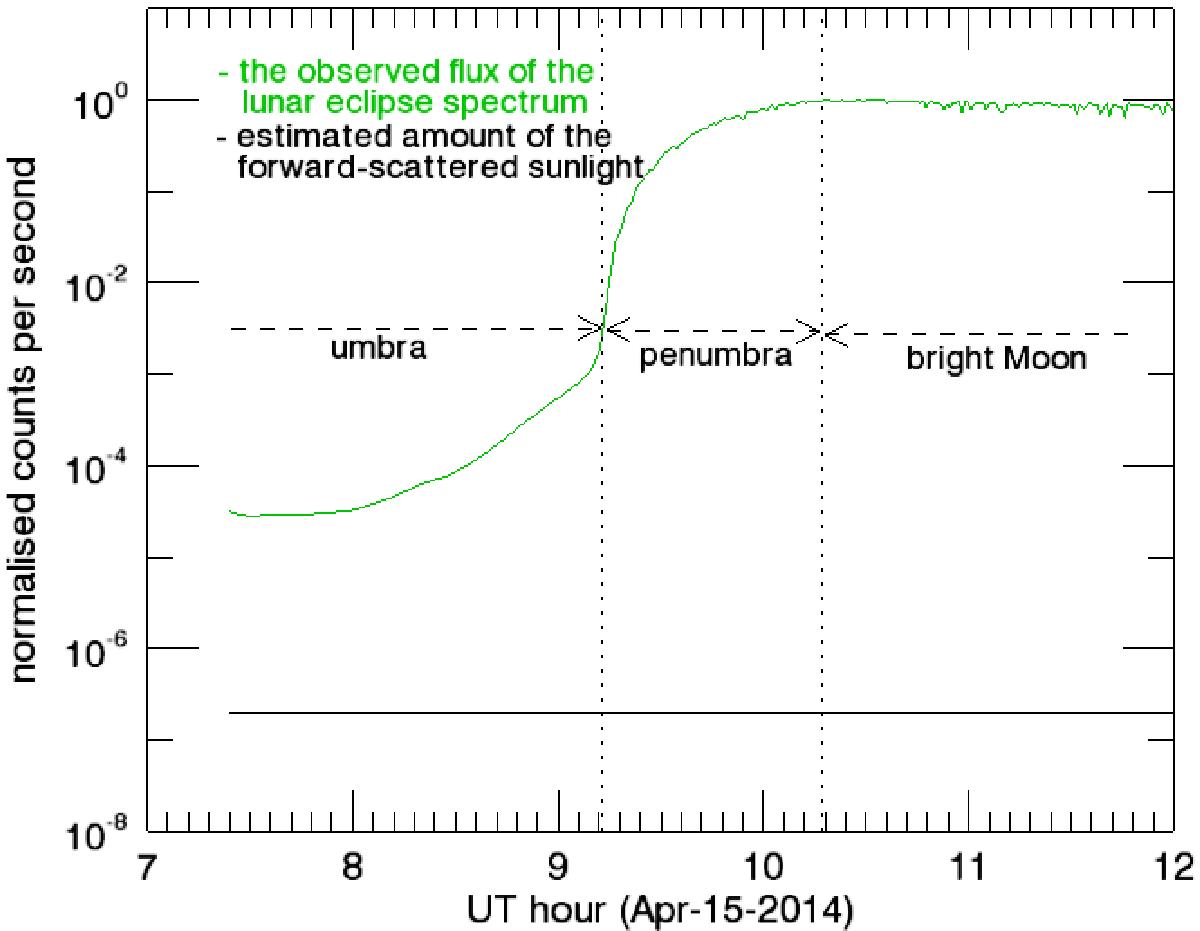
Flux of the lunar eclipse spectrum and the forward-scattered sunlight. The green line is the total observed counts per second between 550–650 nm of the 292 lunar spectra that were observed with CFHT during the 2014-Apr-15 lunar eclipse. The numbers are normalised to a bright Moon spectrum taken at the meridian. The plot can be approximately regarded as the light curve of the eclipsed Moon, which is normalised to the flux of the unobstructed Sun (i.e. the flux for the bright Moon). The black solid line is the estimated forward-scattered sunlight from García Muñoz & Pallé (2011) and the amount used here is 2 × 10⁻⁷ of the flux from the unobstructed Sun.
Current usage metrics show cumulative count of Article Views (full-text article views including HTML views, PDF and ePub downloads, according to the available data) and Abstracts Views on Vision4Press platform.
Data correspond to usage on the plateform after 2015. The current usage metrics is available 48-96 hours after online publication and is updated daily on week days.
Initial download of the metrics may take a while.