Free Access
Fig. 8
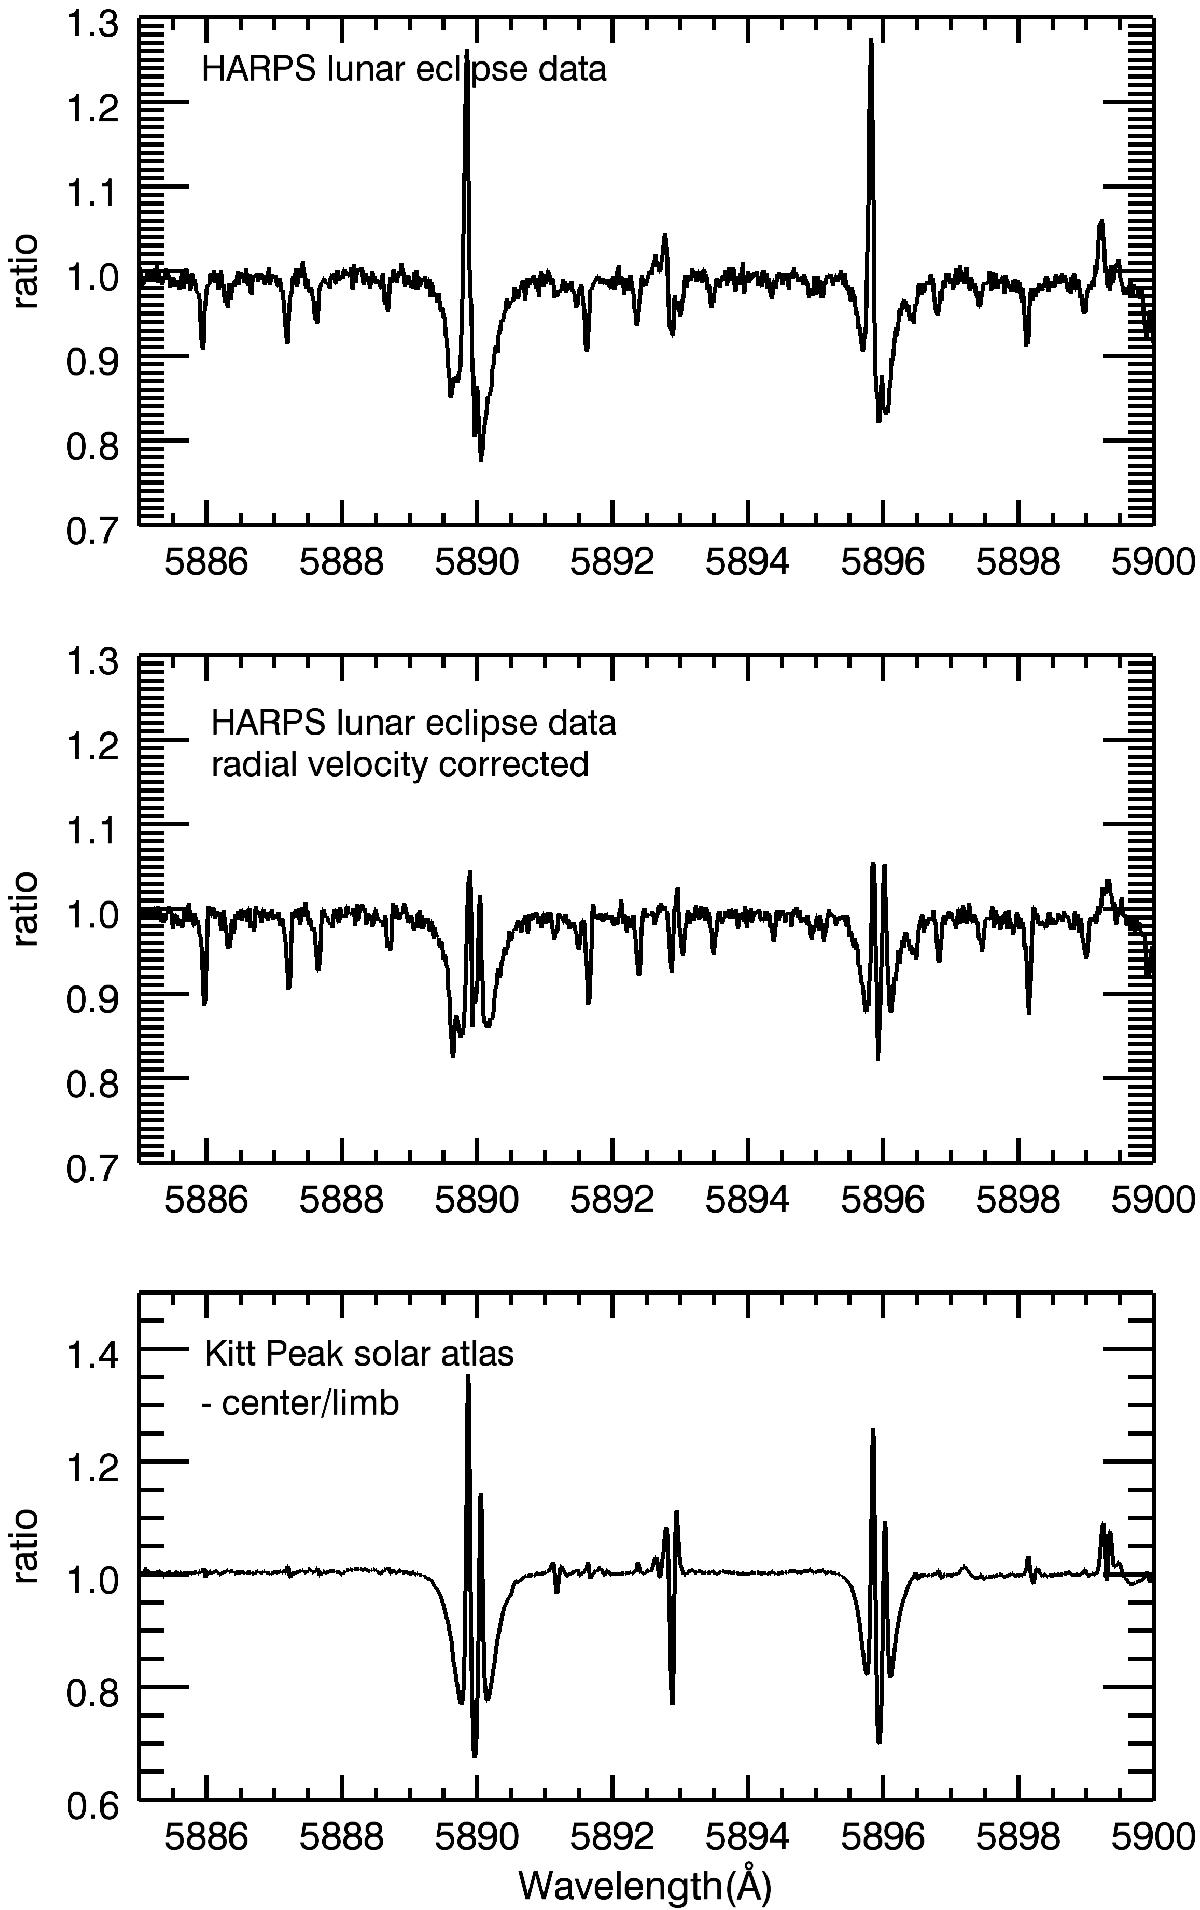
CLV features in the Na i D lines. Top panel: ratio of the bright Moon to penumbral spectrum from the HARPS observation in December 2010. Middle panel: same as top, except with the radial velocity corrections applied. Bottom panel: the centre to limb spectrum from the Kitt Peak Solar Atlas.
Current usage metrics show cumulative count of Article Views (full-text article views including HTML views, PDF and ePub downloads, according to the available data) and Abstracts Views on Vision4Press platform.
Data correspond to usage on the plateform after 2015. The current usage metrics is available 48-96 hours after online publication and is updated daily on week days.
Initial download of the metrics may take a while.