Free Access
Fig. 7
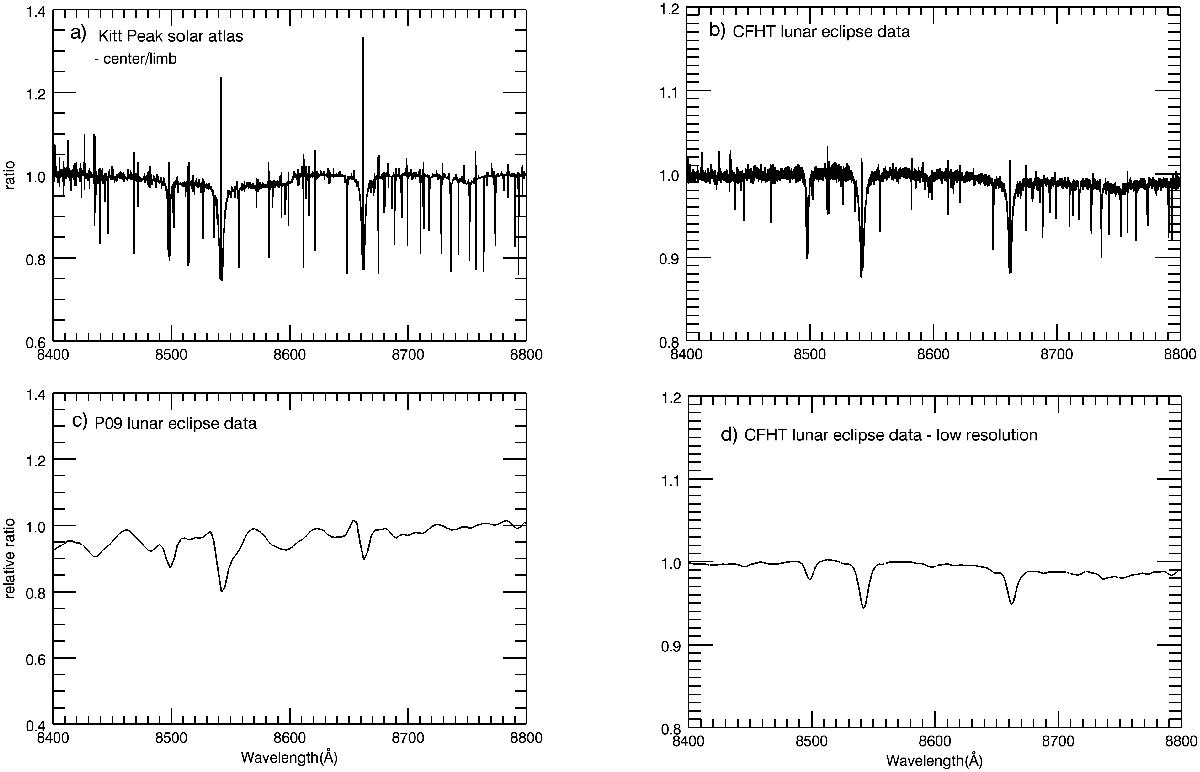
CLV features in the Ca ii T lines. a) Ratio of the centre to limb spectrum from the Kitt Peak Solar Atlas. b) Ratio of the bright Moon spectrum to the penumbral spectrum from our CFHT data. c) Ca ii T feature in P09’s transmission spectrum. d) Same as b) except convolved to the resolution of P09 data.
Current usage metrics show cumulative count of Article Views (full-text article views including HTML views, PDF and ePub downloads, according to the available data) and Abstracts Views on Vision4Press platform.
Data correspond to usage on the plateform after 2015. The current usage metrics is available 48-96 hours after online publication and is updated daily on week days.
Initial download of the metrics may take a while.